DDG search drop in powered by ddg.patdryburgh.com
tl;dr - I ran some cursory tests (dd, iozone, sysbench) to measure and compare IO operation on OpenEBS provisioned storage in comparison with hostPath volumes in my small Kubernetes cluster. Feel free to skip to the results. OpenEBS’s jiva-engine backed volumes have about half the throughput for single large writes (gigabytes) and slightly outperformed hostPath for many small writes. In my opinion, the simplicity and improved ergonomics/abstraction offered by OpenEBS is well worth it. Code is available in the related gitlab repo
I’ve written a bit in the past about my switch to OpenEBS, but I never took the time to do any examination on performance. While I can’t say I’ve ever really needed to maximize disk performance for a database on my tiny Kubernetes cluster (most applications I maintain are doing just fine with SQLite and decent caching), I did want to eventually get a feel for just how much performance is lost when picking a more robust solution like OpenEBS over something like using hostPath (simple but less than ideal from management and security perspectives) or local volumes (safer but still somewhat cumbersome to manage). In this post I’m going to run through some quick tests that will hopefully make it somewhat clearer the cost of the robustness that OpenEBS provides.
I use OpenEBS because it’s easier to install than Rook (which I used previously), for my specific infrastructure, which is running on Heztner dedicated servers which do not expose an easy interface with which to give rook a hard-drive to manage. I’ve written about it before so feel free to check that out for a more detailed explanation. The short version is that I’ve found that undoing Hetzner’s RAID setup has had disastrous consequences whenever I inadvertently updated grub (due to lack of proper support for RAID to start with on the GRUB side), and it’s much easier for me to just stop trying to undo the set up (and go with a robust hard drive volume-provisioning that works with just space on disk). The Rook/Ceph documentation is a little vague, but I’m fairly convinced that Rook (i.e. Ceph underneath) can’t operate over just a folder on disk – of course there are the obvious control issues (linux filesystems can’t really limit folder size easily) to contend with but the only other alternative seems to be creating some loopback virtual drives, but if I don’t want to have to do that provisioning step. Rook also does many things these days – before they were primarily worried about automating ceph clusters and providing storage, but now it can run Cassandra, Minio, etc – at this point I’m really only worried about getting “better than hostPath/local volume” robustness on my tiny cluster.
Anyway, all that out of the way, let’s get into it. The first thing I’m going to do is update my installation of OpenEBS.
The last time I wrote about OpenEBS, I installed OpenEBS using these versions of the control plane:
| Control plane component | Image | Version |
|---|---|---|
openebs-provisioner |
quay.io/openebs/openebs-k8s-provisioner:0.8.0 |
0.8.0 |
snapshot-controller |
quay.io/openebs/snapshot-controller:0.8.0 |
0.8.0 |
api-server |
quay.io/openebs/m-apiserver:0.8.0 |
0.8.0 |
As you can see, version 0.8.0 across the board (check out the previous OpenEBS post for more specifics on the resource definitions used).
At the time of tis post’s creation, a pre-release version of 0.8.1 is available (Check out the OpenEBS releases page for more info). I’m not going to pursue updating to 0.8.1 for this post, but once the release is formally cut, I’ll upgrade and run these tests again (and also detail the upgrade process). The 0.8.1 release has some pretty big fixes and improvements which are pretty amazing, but we’ll leave testing that release until the release actually happens.
Unfortunately, Halfway through cstor volumes stopped working properly 0.8.0 – the following error showed up in the events for any cstor PVCs:
Events:
Type       Reason                Age                     From                                                                                                    Message
----       ------                ----                    ----                                                                                                    -------
Normal     ExternalProvisioning  4m12s (x26 over 9m52s)  persistentvolume-controller                                                                             waiting for a volume to be created, either by external provisioner "openebs.io/provisioner-iscsi" or manually created by system administrator
Normal     Provisioning          2m37s (x6 over 9m52s)   openebs.io/provisioner-iscsi_openebs-provisioner-77dd68645b-tv98t_e39a79e7-5ab5-11e9-a260-2ec80b0e29c2  External provisioner is provisioning volume for claim "storage-testing/1c-2gb-dd-openebs-cstor-data"
Warning    ProvisioningFailed    2m37s (x6 over 9m52s)   openebs.io/provisioner-iscsi_openebs-provisioner-77dd68645b-tv98t_e39a79e7-5ab5-11e9-a260-2ec80b0e29c2  failed to provision volume with StorageClass "openebs-cstor-1r": Internal Server Error: failed to create volume 'pvc-0bdabcc7-5ded-11e9-a847-8c89a517d15e': response: unable to parse requirement: found '<', expected: identifier
Mounted By:  1c-2gb-dd-openebs-cstor-x9s69
I couldn’t find where the configuration could have been wrong (and exactly one job did seem to go through with cstor early on), but to prevent this blog post from getting unnecessarily long I’m going to just skip cStor for now and focus on hostpath vs Jiva (maybe when I upgrade to 0.8.1, I’ll revisit). This is a bit disappointing because cStor has a bunch of features that Jiva doesn’t (and seems to be where the OpenEBS project is going in the future) but for
I’m no linux file system/IO subsystems expert, so my first step was to do some googling, and see what’s out there for testing filesystems. In particular I found the following links particularly concise and helpful:
More importantly, these resources lead me to the better-than-dd test suites – iozone and sysbench, and filebench. I think sysbench is the most established of these in the linux space, but either way I’m going to run all three and see what they tell me. I’m also going to ignore filebench in this case due to the wiki noting that the pre-included stuff isn’t good for modern RAM amounts. Since in my case I really only care about disk IO performance, I think dd, iozone and sysbench are more than enough.
While I won’t be doing much to dampen the load on the system, I will be doing multiple runs to try and lessen the effect of random load spikes on my rented hardware @ Hetzner.
Machine Specs
The basic idea is to run a series of Kubernetes Jobs that will run the relevant tests, and in the job I’ll only be changing the volumes from hostPath to PersistentVolumeClaim (PVC)s supported by OpenEBS provisioned PersistentVolume (PV)s.
To help reproducibility I’ll also be making available a GitLab repository with the mostly automated code I ran – You’ll likely need a Kubernetes cluster to follow along. All runs were performed 10 times and summarized from there (average, std-dev, etc).
dd-based testingThe DD tests are very basic, pieced together from a few reference explanations of decent ways to use dd for this purpose:
We have to be careful to write either disable Linux’s in-memory disk cache or write enough data to ensure we go past what can be cached – I’ve chosen the latter here, so we’ll be writing roughly 2x the amount of memory limits that are given to each pod.
While testing, as you might expect, I ran into OOM-killing on my process:
$ k get pods -n storage-testing
NAME                                                            READY   STATUS      RESTARTS   AGE
1c-1gb-dd-openebs-jiva-fpn4v                                    0/1     OOMKilled   0          4m48s
This has to do with the container not actually flusing to disk fast enough:
Here’s a nice SO post about LXC containers – the idea is that the linux disk write cache is aborbing the single 2GB block (2x the amount of RAM I gave the container) and getting OOM killed. There’s also an LXC mailing list thread which explains the problem nicely – but of course, we’re not using LXC, we’re using containerd
To solve this, we need to tell the kernel to flush more often, but the problem is that the kernel file system (where we might normally echo <value> > /proc/sys/vm/dirty_expire_centisecs) is read-only inside a docker container, which is definitely a good idea security-wise. This means I had to spend some time looking up how to set sysctlss for pods in Kubernetes (I also had to reference the kubelet command line reference). Unfortunately, that lead to another issue – namely that my kubelet didn’t allow modifying that paritcular sysctl:
$ k get pods -n storage-testing
NAME                                                            READY   STATUS            RESTARTS   AGE
1c-1gb-dd-openebs-jiva-rxlc8                                    0/1     SysctlForbidden   0          7s
Unfortunately, the vm.dirty_expire_centisecs does not look to be namespaced yet, so I’m going to change the strategy and avoid writing less than the RAM contents to disk. This seems like a pretty drastic change, but I guess if I find that all 3 methods have the exact same performance profile it will be pretty easy to discount the results, as I’m expecting OpenEBS to impose some performance penalty at least. Maybe this is a good point to make disclaimer that these tests will not do anything for people looking to write 16GB files to disk all at the same time.
Since I need to make some decision, the strategy will be to write half the available memory instead – here are the dd commands I ended up with:
dd if=/dev/zero of=/data/output.img bs=<half of available memory> count=1 oflag=dsyncdd if=/dev/zero of=/data/output.img bs=<half of available memory / 1000> count=1000 oflag=dsyncThese commands work on the version of dd in Alpine’s coreutils package (not the Busybox version that is there by default). Here’s an example pod container spec:
      containers:
        - name: test
          image: alpine:latest
          command: ["/bin/ash"]
          args:
            - -c
            - |
              apk add coreutils;
              dd if=/dev/zero of=/data/throughput.img bs=512M count=1 oflag=dsync 2>&1 | tee /results/$(date +%s).throughput.dd.output;
              dd if=/dev/zero of=/data/latency.img bs=512K count=1000 oflag=dsync 2>&1 | tee /results/$(date +%s).throughput.dd.output;
To see the full configuration, please check out the GitLab repository.
As you might be able to guess, the bs=512M signifies that this was for some 1GB of RAM test (there’s only one, so 1CPU/1GB), and I just approximated 512M/1000 (~.512M) to be ~= 512K. I also left the CPU resourcve limits in, despite the fact that they should not really affect file IO so much – I did want it to be as close to a “real” Pod as normal (and setting resource limits is certainly a best practice for pods).
iozone-based testingFollowing an excellent quick reference to iozone, I’m using the following iozone command:
$ iozone -e -s <half-ram> -a > /results/$(date +%s).iozone.output;
Some notes on this setup:
-s <half-ram> corresponds to half the available memory (so for the 2c-4gb case that would be 2g).-e includes the fsync timing, which is important since otherwise we’d just be testing the linux disk cache-a is automatic mode (which tests a variety of block sizes)The iozone tests took over half a day to run in all (all variations, which means different machine configs and hostpath/openebs-jiva), this is likely because for every configuration (ex. 2 cores, 4gb RAM, w/ an openebs volume), it ran through various block sizes for the file size I gave it (<half-ram>).
sysbench-based testingsysbench is another tool that is pretty commonly used to test file system performance. In trying to figure out a reasonable usage I needed to consult the github documentation as well as calling --help on the command line a few times. I used the severalnines/sysbench docker image, and spent some time in a container trying to figure out how to properly use sysbench.
For example here is what happens if you try to run a fileio test:
root@0058ea7d7215:/# sysbench --threads=1 fileio run
sysbench 1.0.17 (using bundled LuaJIT 2.1.0-beta2)

FATAL: Missing required argument: --file-test-mode

fileio options:
--file-num=N                  number of files to create [128]
--file-block-size=N           block size to use in all IO operations [16384]
--file-total-size=SIZE        total size of files to create [2G]
--file-test-mode=STRING       test mode {seqwr, seqrewr, seqrd, rndrd, rndwr, rndrw}
--file-io-mode=STRING         file operations mode {sync,async,mmap} [sync]
--file-async-backlog=N        number of asynchronous operatons to queue per thread [128]
--file-extra-flags= [LIST,...] list of additional flags to use to open files {sync,dsync,direct} []
--file-fsync-freq=N           do fsync () after this number of requests (0 - don't use fsync ()) [100]
--file-fsync-all [=on|off]     do fsync () after each write operation [off]
--file-fsync-end [=on|off]     do fsync () at the end of test [on]
--file-fsync-mode=STRING      which method to use for synchronization {fsync, fdatasync} [fsync]
--file-merged-requests=N      merge at most this number of IO requests if possible (0 - don't merge) [0]
--file-rw-ratio=N             reads/writes ratio for combined test [1.5]
This lead me to the following commands (for the 1C 2GB example):
$ sysbench --threads=1 --file-test-mode=<mode> --file-fsync-all=on --file-total-size=1G fileio prepare
$ sysbench --threads=1 --file-test-mode=<mode> --file-fsync-all=on --file-total-size=1G fileio run > /results/$(date +%s).seqwr.sysbench.output
file-test-mode can be a few different values so the easiest way to come up with was just to run them all. I was also a little unsure about the difference between fsync and fdatasync and came across a very useful blog post that cleared it up. The sysbench results will be used mostly for latency measurements – at this point I’m getting lazy (this post has taken a while to write), so I’m going to just take the min,avg,max metrics as they’re provided in each test that is run and compare those, I think we’ve got a good enough idea of thoughput with the dd and iozone tests.
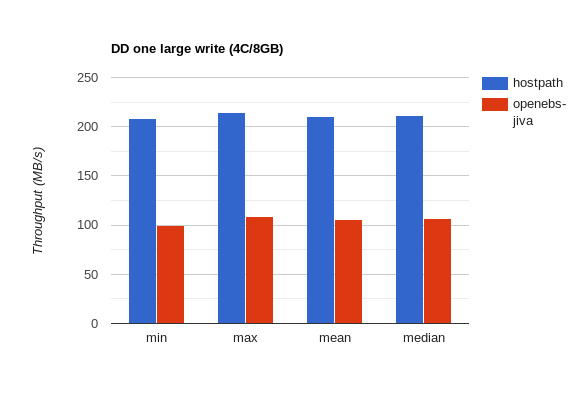
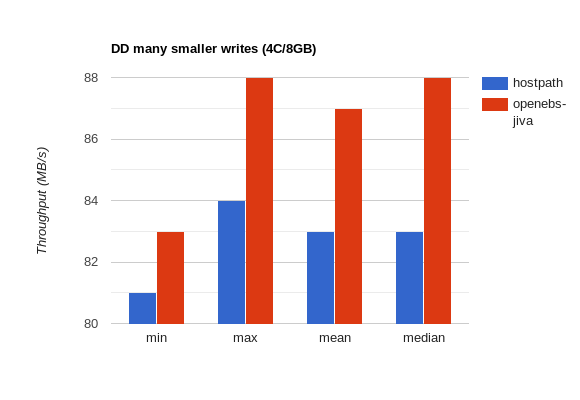
Here are some cherry-picked graphs that should give a rough overview of the results (higher is better except noted otherwise):
DD
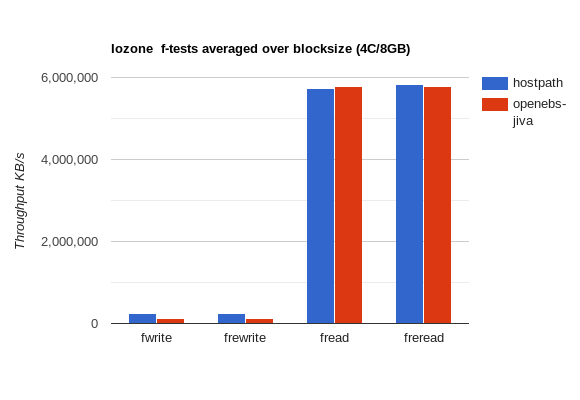
iozone
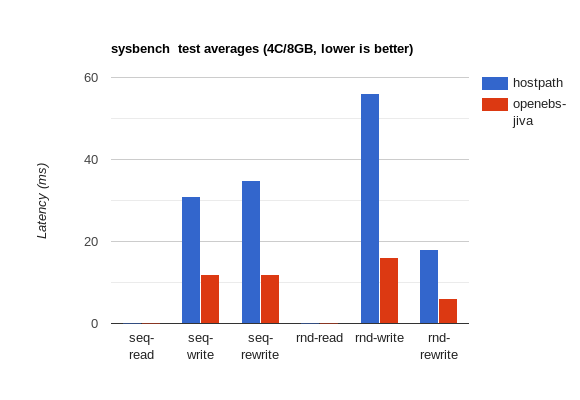
sysbench
Overall – it looks like for large writes openebs-jiva only does half as well as hostPath, but it keeps up and slightly improves on hostPath performance for many small writes.
I couldn’t be bothered with gnuplot (though I originally intended to use it) so I used the first bar graph maker I found online. Hopefully someday a future me will go back and automate this.
Below are the tabulated results for each type of test – please refer to the Setup/Methodology section above if you are interested in methodology/how I arrived at these numbers.
dd-based testingThe results for the dd tests are basically the metrics pulled from dd run output and processed with GNU datamash (which I found out about from a an SO question). Here’s an example of the commands I ran:
# cat /var/storage-testing/1c-2gb/dd/hostpath/*throughput* | grep "MB/s" | awk '//{print $10}' | datamash min 1 max 1 mean 1 median 1
195     208     201.54545454545 201
# cat /var/storage-testing/1c-2gb/dd/openebs-jiva/*throughput* | grep "MB/s" | awk '//{print $10}' | datamash min 1 max 1 mean 1 median 1
103     107     104.27272727273 104
# cat /var/storage-testing/1c-2gb/dd/hostpath/*latency* | grep "MB/s" | awk '//{print $10}' | datamash min 1 max 1 mean 1 median 1
30.3    31.7    31.281818181818 31.4
# cat /var/storage-testing/1c-2gb/dd/openebs-jiva/*latency* | grep "MB/s" | awk '//{print $10}' | datamash min 1 max 1 mean 1 median 1
46.9    48.5    47.572727272727 47.6
1CPU/2GB
One big write:
| Test | Resources | Method | min | max | mean | median |
|---|---|---|---|---|---|---|
dd |
1CPU/2GB | hostPath |
195 MB/s | 208 MB/s | 201.54 MB/s | 201 MB/s |
dd |
1CPU/2GB | openebs-jiva |
103 MB/s | 107 MB/s | 104.27 MB/s | 104 MB/s |
Many smaller writes:
| Test | Resources | Method | min | max | mean | median |
|---|---|---|---|---|---|---|
dd |
1CPU/2GB | hostPath |
30.3 MB/s | 31.7 MB/s | 31.28 MB/s | 31.4 MB/s |
dd |
1CPU/2GB | openebs-jiva |
46.9 MB/s | 48.5 MB/s | 47.57 MB/s | 47.6 MB/s |
2CPU/4GB
One big write:
| Test | Resources | Method | min | max | mean | median |
|---|---|---|---|---|---|---|
dd |
2CPU/4GB | hostPath |
207 MB/s | 212 MB/s | 210 MB/s | 210 MB/s |
dd |
2CPU/4GB | openebs-jiva |
103 MB/s | 109 MB/s | 106.36 MB/s | 107 MB/s |
Many smalller writes:
| Test | Resources | Method | min | max | mean | median |
|---|---|---|---|---|---|---|
dd |
2CPU/4GB | hostPath |
53 MB/s | 54.1 MB/s | 53.76 MB/s | 53.9 MB/s |
dd |
2CPU/4GB | openebs-jiva |
66.4 MB/s | 67.7 MB/s | 67.04 MB/s | 66.9 MB/s |
4CPU/8GB
One big write:
| Test | Resources | Method | min | max | mean | median |
|---|---|---|---|---|---|---|
dd |
4CPU/8GB | hostPath |
208 MB/s | 214 MB/s | 210.72 MB/s | 211 MB/s |
dd |
4CPU/8GB | openebs-jiva |
100 MB/s | 109 MB/s | 106.10 MB/s | 107 MB/s |
Many smaller writes:
| Test | Resources | Method | min | max | mean | median |
|---|---|---|---|---|---|---|
dd |
4CPU/8GB | hostPath |
81.7 MB/s | 84.1 MB/s | 83.41 MB/s | 83.6 MB/s |
dd |
4CPU/8GB | openebs-jiva |
83.3 MB/s | 88.3 MB/s | 87.2 MB/s | 87.5 MB/s |
Notes
openebs actually does better than normal hostPath volumes as far as latency goes, this is likely due to some more efficient batching at the service levelopenebs versus a regular hostPathiozone-based testingiozone based tests produce their own kind of format which I had to parse through to get (so I could stuff it into GNU datamash). Here’s an example of the end of one of the earlier tests I ran:
... lots more text ...
Run began: Sun Apr 14 15:26:48 2019

File size set to 1048576 kB
Auto Mode
Command line used: iozone -s 1g -a
Output is in kBytes/sec
Time Resolution = 0.000001 seconds.
Processor cache size set to 1024 kBytes.
Processor cache line size set to 32 bytes.
File stride size set to 17 * record size.
                                                     random    random     bkwd    record    stride
     kB  reclen    write  rewrite    read    reread    read     write     read   rewrite      read   fwrite frewrite    fread  freread
1048576       4  1329738  2813520  4233952  3946288  3077393  2076758  3464453   3490923   3256488  2634143  2692730  3543277  3499406
1048576       8  1561101  3373710  5766887  5155135  4481634  2815542  4800863   2426742   4613565  3273976  3307341  5053257  5056133
1048576      16  1678212  3809775  6104643  5288415  3495546  3314228  5758966   5703528   5542858  3721749  3719832  5968188  5816561
1048576      32  1757391  4112077  6687042  5796988  3899517  3788562  6580170   6359981   6120172  4091842  4011308  6292985  6274204
1048576      64  1788938  4209306  6705475  5928278  6584258  4051337  6597592   6875774   6345739  4148240  4148091  6636559  6761432
1048576     128  1805999  4165196  6155308  5838684  6396760  4115678  6482856   6781762   6326242  4183743  4154816  6460363  6386013
1048576     256  1807961  4135854  6117575  5545584  6019692  4059085  6415899   6427817   6258356  4215802  4237648  6055181  6130700
1048576     512  1783413  4081699  6191590  5281271  6005005  4120950  6207530   5946739   6154627  4174613  4215818  6100164  6036605
1048576    1024  1782428  4168907  6318471  5503034  6424230  4246604  3874917   6156721   6201657  4208766  3658356  6180271  6202059
1048576    2048  1816527  3876123  6212677  5528421  6232398  4229103  6337071   6150264   6398444  3843415  4020535  6434042  6306276
1048576    4096  1486736  3909344  6186504  5507659  5287112  3457475  6028728   5573350   5965411  3987299  3960445  5936328  3704585
1048576    8192  1600195  3202268  4887669  4442795  3305338  2691645  4917695   3482010   4871250  3126979  3274171  4805396  4746020
1048576   16384  1629628  3118255  4773326  4235028  4689994  2852128  4680765   3217477   4653983  2748085  3168286  4757711  4734897

iozone test complete.
The first two columns are the amount of kb written and the block size resptectively – the rest of the columns are various iozone specific metrics, expressed in kB/s. To roll up the iozone results, I’ll be averaging the measurements across block sizes. This may or may not be relevant to your usecase, but it should give an overall idea when comparing hostPath to openebs performance at least.
Of course, trying to actual get the right information out of these files was somewhat of an undertaking (really just more unix-fu practice). First I started with trying to get the table of numbers out:
$ cat 1c-2gb/iozone/hostpath/1555323673.iozone.output | tail -n -15 | head -n 13
1048576       4   203992   227340  4135205  3849086  2963134   216528  3273281   2407060   2937104   217431   222678  3623451  3601148
1048576       8   214913   232188  4847535  4831389  4156547   218169  4583161   4464746   4239310   224655   225858  5003922  4923260
1048576      16   211075   225661  5412561  5381974  5146864   227503  5406201   4966963   4935592   229125   230148  5872763  5784507
1048576      32   216727   231412  5928078  5705259  5902049   223881  5524255   4156677   5458490   227918   228691  6836464  6671391
1048576      64   211837   232842  6174743  5847938  6524364   228451  5573498   4162948   5951124   228776   226410  7006061  7053477
1048576     128   220116   231463  5885652  5613692  6070534   231023  5672696   5841911   5551667   229371   230316  6022041  6545990
1048576     256   210254   230382  5545031  5303657  5695934   231303  5082626   5099634   5612911   226474   230220  5871579  5815184
1048576     512   222408   230690  5636752  5320454  5722638   229017  5523651   5124502   5480890   230370   228140  6318970  6409186
1048576    1024   214652   229361  5860063  5364408  5936640   224247  5570956   4046775   5580435   227235   227044  6516697  6395671
1048576    2048   216388   232562  4782295  5232544  5944440   230731  5440448   4988874   5560673   227781   230524  6427779  6276908
1048576    4096   212442   228526  4988852  5343960  5839793   229451  5995116   4532952   5420146   229946   228397  6264115  6253169
1048576    8192   213020   220035  4447040  4400494  4845009   224134  3032650   2994194   4454517   219029   228215  4740654  4904905
1048576   16384   219433   224104  4256744  4114369  4482835   226294  4157746   2561086   4631088   226311   227024  4803810  4760265
Then to sum up those numbers column wise (so across reclen, AKA block size), we can feed this data into datamash (-W broadens whitespace handling, and we get min/max/mean/median for the 3rd column of values):
$ cat 1c-2gb/iozone/hostpath/1555323673.iozone.output | tail -n -15 | head -n 13 | datamash -W min 3 max 3 mean 3 median 3
203992  222408  214404.38461538 214652
And just to confirm that I’m not using datamash wrong, the minimum write column value is clearly 203992, the max value is clearly 222408, and the mean is ~214404. All that’s needed is to repeat this for the other columns and files (with a tiny bit more bash magic to combine the file excerpts):
$ for f in 1c-2gb/iozone/hostpath/*.iozone.output; do cat $f | tail -n -15 | head -n 13; done > /tmp/1c-2gb-combined.txt
# lots of output in that /tmp file, 130 lines for 10 test runs with 13 lines each
And feed the output of that into datamash:
$ for f in 1c-2gb/iozone/hostpath/*.iozone.output; do cat $f | tail -n -15 | head -n 13; done | datamash -W mean 3
I’ve chosen here to take averages of the numbers because I think it gives a decent sense of each test type that iozone but I’m sure I’m wrong (and can’t wait to see the emails telling me just how much :). The below measurements are in KB/s.
1CPU/2GB
| Test | Resources | Method | write | rewrite | read | reread | random read | random write | bkwd read | record rewrite | stride read | fwrite | frewrite | fread | freread |
|---|---|---|---|---|---|---|---|---|---|---|---|---|---|---|---|
iozone |
1CPU/2GB | hostPath |
214045.8 |
228291.5 |
5119468.5 |
4865668.9 |
5097556.4 |
223181.9 |
4835166.3 |
4099065.3 |
4813667.8 |
223755 |
225049.4 |
5484053.3 |
5488995.7 |
iozone |
1CPU/2GB | openebs-jiva |
1112719.3 |
119869.7 |
5522036.8 |
5048935 |
5324095.5 |
118863.5 |
5345608.9 |
4496415.1 |
5188153.3 |
112645.2 |
120023.6 |
5477231.1 |
5482449.5 |
2CPU/4GB
| Test | Resources | Method | write | rewrite | read | reread | random read | random write | bkwd read | record rewrite | stride read | fwrite | frewrite | fread | freread |
|---|---|---|---|---|---|---|---|---|---|---|---|---|---|---|---|
iozone |
2CPU/4GB | hostPath |
223080.3 |
229733 |
5486789.8 |
5100119 |
5260126.5 |
226252.5 |
5292155.5 |
4674197.7 |
5060957.2 |
228253.3 |
229182.1 |
5690462.3 |
5701447.4 |
iozone |
2CPU/4GB | openebs-jiva |
109808.2 |
110455.8 |
5639117.1 |
5198092.4 |
5467786.2 |
110561.6 |
5494932.7 |
4625088.5 |
5282346 |
111316 |
110935 |
5662448.7 |
5650025 |
4CPU/8GB
| Test | Resources | Method | write | rewrite | read | reread | random read | random write | bkwd read | record rewrite | stride read | fwrite | frewrite | fread | freread |
|---|---|---|---|---|---|---|---|---|---|---|---|---|---|---|---|
iozone |
4CPU/8GB | hostPath |
238619.8 |
243632 |
5655604.9 |
5190182.3 |
5460749.8 |
233658.5 |
5446474.5 |
4832785.1 |
5389630.8 |
237220.2 |
237409.5 |
5734645.4 |
5826861.1 |
iozone |
4CPU/8GB | openebs-jiva |
113276.4 |
113386 |
5773971.9 |
5297572.3 |
5507035.9 |
108030.1 |
5543742.1 |
4927512.1 |
5463138.2 |
113765.4 |
113682.7 |
5783143.5 |
5788586.3 |
Notes
iozone took much longer than the dd based tests, as it runs through lots more steps (and lots more output)iozone output was pretty painful (though to be fair I should have scripted)dd based tests – write, fwrite, frewrite are all about 50% with openebs-jiva versus hostPath usagesysbench-based testingSysbench results are yet another format, which looks something like this:
sysbench 1.0.15 (using bundled LuaJIT 2.1.0-beta2)

Running the test with following options:
Number of threads: 1
Initializing random number generator from current time


Extra file open flags: (none)
128 files, 8MiB each
1GiB total file size
Block size 16KiB
Number of IO requests: 0
Read/Write ratio for combined random IO test: 1.50
Calling fsync () after each write operation.
Using synchronous I/O mode
Doing random r/w test
Initializing worker threads...

Threads started!


File operations:
reads/s:                      51.14
writes/s:                     34.16
fsyncs/s:                     34.16

Throughput:
read, MiB/s:                  0.80
written, MiB/s:               0.53

General statistics:
total time:                          10.0094s
total number of events:              854

Latency (ms):
min:                                    0.00
avg:                                   11.72
max:                                   93.90
95th percentile:                       36.89
sum:                                10006.59

Threads fairness:
events (avg/stddev):           854.0000/0.00
execution time (avg/stddev):   10.0066/0.00
The sysbench results will be used mostly for latency measurements – at this point I’m getting lazy (this post has taken a while to write), so I’m going to just take the min,avg,max metrics as they’re provided in each test that is run and compare those, I think we’ve got a good enough idea of thoughput with the dd and iozone tests. Since I’m using the pre-aggregated measurements (the provided min, max, avg, etc) I will be more explicit about which tests were which.
1CPU/2GB
| Test | Resources | Method | Test | Latency min (ms) | Latency avg (ms) | Latency max (ms) | Latency 95th percentile |
|---|---|---|---|---|---|---|---|
sysbench |
1CPU/2GB | hostPath |
Sequential Read (seqrd) |
0.00 |
0.00 |
100.16 |
0.00 |
sysbench |
1CPU/2GB | openebs-jiva |
Sequential Read (seqrd) |
0.00 |
0.00 |
4.10 |
0.00 |
sysbench |
1CPU/2GB | hostPath |
Sequential Write (seqwr) |
21.98 |
26.43 |
65.16 |
38.94 |
sysbench |
1CPU/2GB | openebs-jiva |
Sequential Write (seqwr) |
9.58 |
12.23 |
105.48 |
22.28 |
sysbench |
1CPU/2GB | hostPath |
Sequential ReWrite (seqrewr) |
22.20 |
27.13 |
67.80 |
41.10 |
sysbench |
1CPU/2GB | openebs-jiva |
Sequential ReWrite (seqrewr) |
1.92 |
12.08 |
107.15 |
22.28 |
sysbench |
1CPU/2GB | hostPath |
Random Read (rndrd) |
0.00 |
0.00 |
100.14 |
0.00 |
sysbench |
1CPU/2GB | openebs-jiva |
Random Read (rndrd) |
0.00 |
0.00 |
100.16 |
0.00 |
sysbench |
1CPU/2GB | hostPath |
Random Write (rndwr) |
22.09 |
27.64 |
68.94 |
43.39 |
sysbench |
1CPU/2GB | openebs-jiva |
Random Write (rndwr) |
1.75 |
12.03 |
58.33 |
22.28 |
sysbench |
1CPU/2GB | hostPath |
Random ReWrite (rndrw) |
0.00 |
10.86 |
68.93 |
34.33 |
sysbench |
1CPU/2GB | openebs-jiva |
Random ReWrite (rndrw) |
0.00 |
4.88 |
83.76 |
11.24 |
2CPU/4GB
| Test | Resources | Method | Test | Latency min (ms) | Latency avg (ms) | Latency max (ms) | Latency 95th percentile |
|---|---|---|---|---|---|---|---|
sysbench |
2CPU/4GB | hostPath |
Sequential Read (seqrd) |
0.00 |
0.00 |
100.12 |
0.00 |
sysbench |
2CPU/4GB | openebs-jiva |
Sequential Read (seqrd) |
0.00 |
0.00 |
4.14 |
0.00 |
sysbench |
2CPU/4GB | hostPath |
Sequential Write (seqwr) |
22.18 |
27.35 |
81.72 |
40.37 |
sysbench |
2CPU/4GB | openebs-jiva |
Sequential Write (seqwr) |
6.52 |
12.14 |
53.16 |
22.28 |
sysbench |
2CPU/4GB | hostPath |
Sequential ReWrite (seqrewr) |
22.03 |
26.00 |
59.44 |
37.56 |
sysbench |
2CPU/4GB | openebs-jiva |
Sequential ReWrite (seqrewr) |
8.51 |
11.97 |
58.01 |
22.69 |
sysbench |
2CPU/4GB | hostPath |
Random Read (rndrd) |
0.00 |
0.00 |
96.08 |
0.00 |
sysbench |
2CPU/4GB | openebs-jiva |
Random Read (rndrd) |
0.00 |
0.00 |
4.12 |
0.00 |
sysbench |
2CPU/4GB | hostPath |
Random Write (rndwr) |
22.63 |
51.70 |
97.32 |
68.05 |
sysbench |
2CPU/4GB | openebs-jiva |
Random Write (rndwr) |
3.24 |
13.82 |
112.46 |
33.72 |
sysbench |
2CPU/4GB | hostPath |
Random ReWrite (rndrw) |
0.00 |
12.23 |
126.44 |
42.61 |
sysbench |
2CPU/4GB | openebs-jiva |
Random ReWrite (rndrw) |
0.00 |
5.30 |
96.86 |
21.89 |
4CPU/8GB
| Test | Resources | Method | Test | Latency min (ms) | Latency avg (ms) | Latency max (ms) | Latency 95th percentile |
|---|---|---|---|---|---|---|---|
sysbench |
4CPU/8GB | hostPath |
Sequential Read (seqrd) |
0.00 |
0.00 |
47.14 |
0.01 |
sysbench |
4CPU/8GB | openebs-jiva |
Sequential Read (seqrd) |
0.00 |
0.01 |
75.85 |
0.01 |
sysbench |
4CPU/8GB | hostPath |
Sequential Write (seqwr) |
22.13 |
30.91 |
126.20 |
53.85 |
sysbench |
4CPU/8GB | openebs-jiva |
Sequential Write (seqwr) |
8.83 |
12.51 |
124.40 |
22.69 |
sysbench |
4CPU/8GB | hostPath |
Sequential ReWrite (seqrewr) |
21.98 |
35.52 |
76.10 |
59.99 |
sysbench |
4CPU/8GB | openebs-jiva |
Sequential ReWrite (seqrewr) |
4.61 |
12.18 |
64.30 |
22.69 |
sysbench |
4CPU/8GB | hostPath |
Random Read (rndrd) |
0.00 |
0.00 |
4.06 |
0.01 |
sysbench |
4CPU/8GB | openebs-jiva |
Random Read (rndrd) |
0.00 |
0.00 |
4.08 |
0.01 |
sysbench |
4CPU/8GB | hostPath |
Random Write (rndwr) |
22.66 |
55.85 |
128.62 |
78.60 |
sysbench |
4CPU/8GB | openebs-jiva |
Random Write (rndwr) |
4.38 |
16.45 |
133.18 |
45.79 |
sysbench |
4CPU/8GB | hostPath |
Random ReWrite (rndrw) |
0.00 |
18.19 |
127.80 |
64.47 |
sysbench |
4CPU/8GB | openebs-jiva |
Random ReWrite (rndrw) |
0.00 |
6.39 |
174.27 |
23.10 |
These numbers are kind of all over the place (in some places the latency hostPath is better, and in others openebs-jiva does better), but a few things seem to stand out:
jiva’s 4ms), this might have a very direct cause (possibly misconfiguration on my part or some specific test settings that are triggering behavior).openebs-jiva seems to be ~2-3x faster at sequential writes & rewritesopenebs-jiva seems to be ~2x faster at random writes & rewritesopenebs-jiva seems to have an increase in max latency for reads but performs similarly to hostPath.These tests weren’t particularly rigorous and there is much that could be improved upon but I think it’s still worth noting some areas that could be improved – if you notice any glaring errors in methodology please feel free to [email me](mailto:vados@vadosware.io?subject=Regarding the OpenEBS IO benchmark) and I can make them more explicit in this section (or if severe enough, warn people of the flaws up top).
Primarily the biggest drawback of these experiments was not automating more of the results processing – while it wouldn’t have taken super long to write some scripts to parse the output and generate some structured output (likely JSON), I didn’t take the time to do that, and opted for bash magic instead, relying heavily on datamash and unix shell-fu.
One thing I didn’t really properly explore were the failure modes of OpenEBS – There are differences between the Jiva and CStor file system options, as well as how live systems shift when nodes go down. I don’t remember where I read it (some random blog post?), but I’ve heard some bad things about some failure modes of openebs, for now all I can find to back this up is:
Another thing that is conspicuously missing is a proper test of distant servers behavior – it would be much more interesting to test on a bigger cluster and simulate a failure of a replica closest to the actual compute that’s doing the file IO – how does the system perform if the OpenEBS data-plane components it’s talking to are across a continent or an ocean? This is something that likely wouldn’t really happen in practice unless something was seriously wrong, but it would be nice to know.
Originally I meant to also include some pgbench runs as well, but considering how long it took to write this post, I decided to skip or now – I think the tests do enough to describe file I/O throughput and latency, so we’ve got a good idea how a more realistic workload like postgres would run. In the future, maybe I’ll do another separate measurement of pgbench (likely when version 0.8.1 of OpenEBS actually lands).
It was pretty interesting to dip in to the world of hard-drive testing and to get a chance to compare OpenEBS to the easiest (but mosy unsafe/fragile) way of provisioning volumes on k8s. Glad to see how OpenEBS was able to perform – it only lagged behind in large file writes, and actually did slightly better than hostPath for lots of small writes which is great. I only tested the jiva engine, so eventually I expect much greater things from cStor.
Looks like OpenEBS is still my go-to for easy-to-deploy dynamic local-disk provisioning and management (and probably will be for some time).