DDG search drop in powered by ddg.patdryburgh.com
tl;dr - My cluster-wide prometheus scraping config was picking up port 25 as a good place to send GET /metrics requests, and broke my surprisingly fragile email setup (Haraka -> Maddy), simply by inundating it with invalid HTTP requests to a port meant for SMTP.
My mailer setup makes use of two pretty good F/OSS tools that I rarely have problems with:
They work great, and I don’t spend much time thinking about them – I often set up a new maddy instance with separate backups and what-not for every project, (for example NoMorePizzaParties.com – if you send an email to me @ admin@nomorepizzaparties.com it goes through this setup). It’s a multiplexed setup, so architecture wise it looks like this:
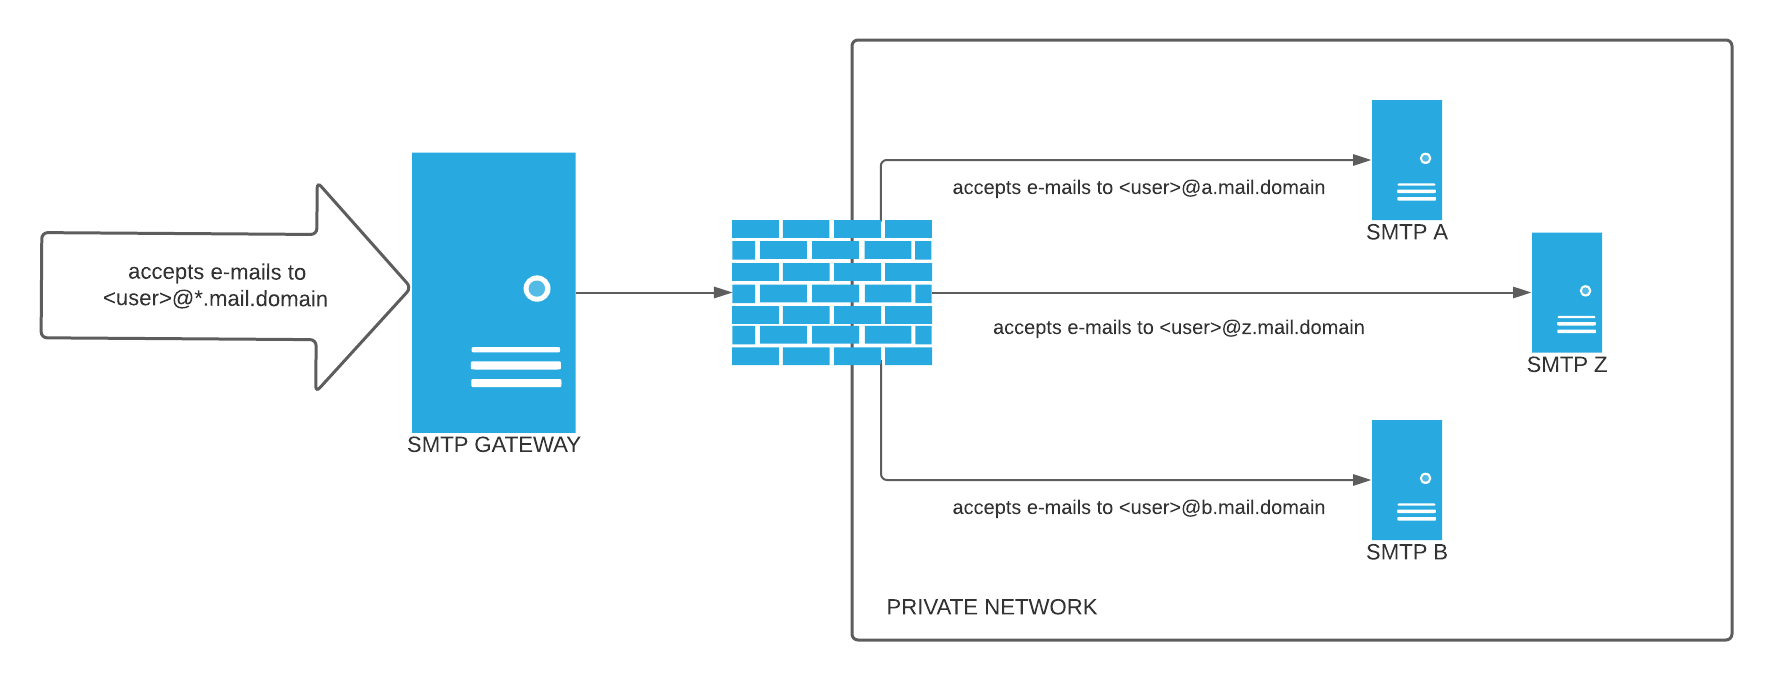 (credit: https://serverfault.com/questions/1076025/inbound-smtp-relay-with-haraka)
All was well and good, until a couple days ago when I realized that I wasn’t actually getting the mail I expected, my inbox had been uncharacteristically empty (even the spam stopped coming!). I remembered making some relatively recent DNS changes, so my mind immediately jumped there, but all was fine on that front (this time!).
Some alerts were also flying on my GMail account which I use to test from time to time – emails were not getting through. Outbound emails were working (ex. admin@myproject.com -> someone@example.com) but inbound emails someone@example.com -> admin@myproject.com) were not.
What followed was a 1.5 day hair-pulling exercise trying to figure out what was wrong, and this post is an attempt to gather the notes I made into some sort of coherent narrative. You really might want to read the TL;DR instead of any of what comes from now. The things at play that make this more difficult than normal (all this complexity is self-inflicted of course!):
As you can see, there are quite a few moving pieces (more than there strictly need to be), and I paid the price for my complexity with longer debugging time. Anyway, let’s get into it so hopefully some gems fall out that someone else can use in the future.
To be more precise – the process of receiving messages fashioned in accordance with SMTP over port 25 was not functioning properly
GMail was one of the first to alert me, when I received the following after sending a routine email to myself:
The recipient server did not accept our requests to connect. Learn more at https://support.google.com/mail/answer/7720 [mail.nomorepizzaparties.com. XXX.XXX.XXX.XXX: unable to read banner] [mail.nomorepizzaparties.com. XXX.XXX.XXX.XXX: unable to read banner] [mail.nomorepizzaparties.com. XXX.XXX.XXX.XXX: timed out] [mail.nomorepizzaparties.com. XXX.XXX.XXX.XXX: timed out]
OK, so looks like we’ve got our first clue, and it’s not a particularly straight forward one! We’re suffering from at least two issues:
These problems are weird for two obvious reasons:
DaemonSet so every server should return roughly the same result (or fail in a similar way)!Well the good news is round robin DNS is working at the very least, the problem is not DNS.
The first obvious place to look is haraka – I don’t change the set up much outside of adding/removing top level domains (I need to turn this into an operator at some point), but for some reason domains just won’t receive mail despite the setup not changing in that respect. As you might imagine, I took a look at the Haraka logs:
2022-01-15T11:03:21.560Z [DEBUG] [-] [core] addOCSP: not available
2022-01-15T11:03:21.560Z [NOTICE] [6B99EE3C-95F6-4EDA-B135-BFF7CE0455EC] [core] connect ip=10.244.192.65 port=36020 local_ip=:: local_port=25
2022-01-15T11:03:21.561Z [DEBUG] [6B99EE3C-95F6-4EDA-B135-BFF7CE0455EC] [core] running connect_init hooks
2022-01-15T11:03:21.561Z [DEBUG] [6B99EE3C-95F6-4EDA-B135-BFF7CE0455EC] [core] running connect_init_respond
2022-01-15T11:03:21.561Z [DEBUG] [6B99EE3C-95F6-4EDA-B135-BFF7CE0455EC] [core] running lookup_rdns hooks
2022-01-15T11:03:21.561Z [DEBUG] [6B99EE3C-95F6-4EDA-B135-BFF7CE0455EC] [core] [early_talker] state=4 esmtp=false line="GET /metrics HTTP/1.1"
2022-01-15T11:03:21.561Z [DEBUG] [6B99EE3C-95F6-4EDA-B135-BFF7CE0455EC] [core] running connect hooks
2022-01-15T11:03:21.561Z [DEBUG] [6B99EE3C-95F6-4EDA-B135-BFF7CE0455EC] [core] running connect hook in toobusy plugin
2022-01-15T11:03:21.561Z [DEBUG] [6B99EE3C-95F6-4EDA-B135-BFF7CE0455EC] [core]  hook=connect plugin=toobusy function=check_busy params="" retval=CONT msg=""
2022-01-15T11:03:21.561Z [DEBUG] [6B99EE3C-95F6-4EDA-B135-BFF7CE0455EC] [core] running connect hook in dnsbl plugin
2022-01-15T11:03:21.561Z [DEBUG] [6B99EE3C-95F6-4EDA-B135-BFF7CE0455EC] [dnsbl] skip private: 10.244.192.65
2022-01-15T11:03:21.562Z [DEBUG] [6B99EE3C-95F6-4EDA-B135-BFF7CE0455EC] [core]  hook=connect plugin=dnsbl function=connect_first params="" retval=CONT msg=""
2022-01-15T11:03:21.562Z [DEBUG] [6B99EE3C-95F6-4EDA-B135-BFF7CE0455EC] [core] running unrecognized_command hooks
2022-01-15T11:03:21.562Z [DEBUG] [6B99EE3C-95F6-4EDA-B135-BFF7CE0455EC] [core] running unrecognized_command hooks
2022-01-15T11:03:21.562Z [DEBUG] [6B99EE3C-95F6-4EDA-B135-BFF7CE0455EC] [core] running unrecognized_command hooks
2022-01-15T11:03:21.562Z [DEBUG] [6B99EE3C-95F6-4EDA-B135-BFF7CE0455EC] [core] running unrecognized_command hooks
2022-01-15T11:03:21.562Z [DEBUG] [6B99EE3C-95F6-4EDA-B135-BFF7CE0455EC] [core] running unrecognized_command hooks
2022-01-15T11:03:21.562Z [DEBUG] [6B99EE3C-95F6-4EDA-B135-BFF7CE0455EC] [core] running unrecognized_command hooks
2022-01-15T11:03:21.562Z [DEBUG] [6B99EE3C-95F6-4EDA-B135-BFF7CE0455EC] [core] running unrecognized_command hooks
2022-01-15T11:03:21.563Z [INFO] [6B99EE3C-95F6-4EDA-B135-BFF7CE0455EC] [core] client [10.244.192.65] half closed connection
2022-01-15T11:03:21.563Z [DEBUG] [6B99EE3C-95F6-4EDA-B135-BFF7CE0455EC] [core] client has disconnected
2022-01-15T11:03:21.563Z [DEBUG] [6B99EE3C-95F6-4EDA-B135-BFF7CE0455EC] [core] running disconnect hooks
2022-01-15T11:03:21.563Z [DEBUG] [6B99EE3C-95F6-4EDA-B135-BFF7CE0455EC] [core] client has disconnected
2022-01-15T11:03:21.564Z [DEBUG] [6B99EE3C-95F6-4EDA-B135-BFF7CE0455EC] [core] client has disconnected
2022-01-15T11:03:21.564Z [NOTICE] [6B99EE3C-95F6-4EDA-B135-BFF7CE0455EC] [core] disconnect ip=10.244.192.65 rdns=NXDOMAIN helo="" relay=N early=Y esmtp=N tls=N pipe=N errors=7 txns=0 rcpts=0/0/0 msgs=0/0/0 bytes=0 lr="500 Unrecognized command" time=0.004
Well that’s extra weird! Something is attempting to retrieve metrics off of the port expressly designated for SMTP traffic. Why in the world would something do that? Sounds like some bad automation afoot. This is a trail I have to run down at some point… Why not now?
GET /metrics) from Haraka?At first I tried to find I tried to find the IP, which is k8s internal (we know this because my pod CIDR happens to be 10.244.xxx.xxx), and the IP was gone. I searched the simplest way I know how:
$ kubectl get pods --all-namespaces -o=wide | grep "10.244.192.65"
I got nothing from that, and got even more confused. Time to break out some more tooling that’s a bit more honest/informed. I choose to break out tcpdump which I’m not an expert with, but I know enough about to know that it’s a good introspective tool and probably the right tool for tracking down packets that shouldn’t be flying but are. So I picked a machine in the cluster, got on, and here’s the tcpdump output:
12:25:13.855068 IP 10.244.136.193.41930 > 10.244.206.186.smtp: Flags [.], ack 227, win 506, options [nop,nop,TS val 4143184933 ecr 1782800009], length 0
12:25:13.855089 IP 10.244.136.193.41930 > 10.244.206.186.smtp: Flags [F.], seq 248, ack 227, win 506, options [nop,nop,TS val 4143184933 ecr 1782800009], length 0
12:25:13.856047 IP 10.244.206.186.smtp > 10.244.136.193.41930: Flags [F.], seq 227, ack 249, win 501, options [nop,nop,TS val 1782800010 ecr 4143184933], length 0
12:25:13.861182 IP 10.244.136.193.41930 > 10.244.206.186.smtp: Flags [.], ack 228, win 506, options [nop,nop,TS val 4143184939 ecr 1782800010], length 0
12:25:21.559282 IP 10.244.192.65.48078 > 10.244.206.186.smtp: Flags [S], seq 1254649318, win 64860, options [mss 1410,sackOK,TS val 2486956687 ecr 0,nop,wscale 7], length 0
12:25:21.559341 IP 10.244.206.186.smtp > 10.244.192.65.48078: Flags [S.], seq 1228986960, ack 1254649319, win 64308, options [mss 1410,sackOK,TS val 2908237046 ecr 2486956687,nop,wscale 7], length 0
12:25:21.559696 IP 10.244.192.65.48078 > 10.244.206.186.smtp: Flags [.], ack 1, win 507, options [nop,nop,TS val 2486956688 ecr 2908237046], length 0
12:25:21.559923 IP 10.244.192.65.48078 > 10.244.206.186.smtp: Flags [P.], seq 1:246, ack 1, win 507, options [nop,nop,TS val 2486956688 ecr 2908237046], length 245: SMTP: GET /metrics HTTP/1.1
12:25:21.559952 IP 10.244.206.186.smtp > 10.244.192.65.48078: Flags [.], ack 246, win 501, options [nop,nop,TS val 2908237046 ecr 2486956688], length 0
12:25:21.562254 IP 10.244.206.186.smtp > 10.244.192.65.48078: Flags [P.], seq 1:45, ack 246, win 501, options [nop,nop,TS val 2908237049 ecr 2486956688], length 44: SMTP: 220 haraka-frccz ESMTP Haraka/2.8.27 ready
12:25:21.562591 IP 10.244.192.65.48078 > 10.244.206.186.smtp: Flags [.], ack 45, win 507, options [nop,nop,TS val 2486956691 ecr 2908237049], length 0
12:25:21.562619 IP 10.244.206.186.smtp > 10.244.192.65.48078: Flags [P.], seq 45:175, ack 246, win 501, options [nop,nop,TS val 2908237049 ecr 2486956691], length 130: SMTP: 500 Unrecognized command
12:25:21.562921 IP 10.244.192.65.48078 > 10.244.206.186.smtp: Flags [F.], seq 246, ack 45, win 507, options [nop,nop,TS val 2486956691 ecr 2908237049], length 0
12:25:21.562942 IP 10.244.192.65.48078 > 10.244.206.186.smtp: Flags [.], ack 175, win 506, options [nop,nop,TS val 2486956691 ecr 2908237049], length 0
12:25:21.562971 IP 10.244.206.186.smtp > 10.244.192.65.48078: Flags [P.], seq 175:227, ack 247, win 501, options [nop,nop,TS val 2908237049 ecr 2486956691], length 52: SMTP: 500 Unrecognized command
12:25:21.563258 IP 10.244.206.186.smtp > 10.244.192.65.48078: Flags [F.], seq 227, ack 247, win 501, options [nop,nop,TS val 2908237050 ecr 2486956691], length 0
12:25:21.563291 IP 10.244.192.65.48078 > 10.244.206.186.smtp: Flags [.], ack 227, win 506, options [nop,nop,TS val 2486956691 ecr 2908237049], length 0
12:25:21.563569 IP 10.244.192.65.48078 > 10.244.206.186.smtp: Flags [.], ack 228, win 506, options [nop,nop,TS val 2486956692 ecr 2908237050], length 0
OK, a little bit more information here – in particular we can see where 10.244.192.65 is sending that GET /metrics request (glad it’s HTTP 1.1 so it’s nice and easy to parse/read) to 10.244.206.186 and it’s responding with 500 Unrecognized command because something is trying to speak HTTP to an SMTP server.
There are few more IPs showing up here, so let’s try and grab one and see if there’s a matching pod that we can catch….
$ k get pods -o=wide --all-namespaces | grep "10.244.206.186"
email                     haraka-frccz                                1/1     Running     0          3h23m   10.244.206.186    node-6.eu-central-1   <none>           <none>
totejo                    totejo-backups-27368640-cmsqs               0/1     Completed   0          35h     10.244.206.186    node-6.eu-central-1   <none>           <none>
Things get weirder, as a conflict I thought was pretty much an invariant property of Kubernetes is staring me in the face – two pods (granted one is Completed, the result of a [Cron]Job) have the same IP address! Turns out this si a thing that happens.
Running into this seeming bug at the k8s level is offputting, but brings about a theory – What if something that normally queries workloads like regular pods and jobs is mistaking a Haraka DaemonSet instance as a previously existing pod/job, scanning it’s ports/entrypoints and trying to send a GET /metrics to the first one that comes up?. Who would have set up such a mindless automation? (Narrator: the author did in fact set up such a mindless automation).
10.244.192.65?Well I can’t find the workload that’s running @ 10.244.192.65, but can I at least find what machine it’s running on? Enter the iproute2 command (ip route):
root@node-6 ~ # ip route
# .... a bunch of stuff ...
10.244.192.64/26 via 10.244.192.64 dev vxlan.calico onlink
10.244.192.128/26 via 10.244.192.64 dev vxlan.calico onlink
10.244.206.187 dev cali45e584c50d7 scope link
10.244.206.188 dev cali42f4f242e57 scope link
10.244.206.189 dev cali5424baea702 scope link
10.244.206.190 dev cali3fd212bb5e7 scope link
# .... a bunch of entries of stuff ...
OK, so the bulk of entries fell into the above two different kinds – one for gateways with next hops (indicated by via) and a bunch of direct routes. It’s all managed by calico so wee vxlan.calico and cali-xxxxxxxxxxxxx entries. We’re getting a peek at the VXLAN based setup here, we can see that the machine that I’m on (node-6)is actually maintaining VXLANs and a bunch of intra-node devices as well. It looks like this machine is responsible for the CIDR from which I’d expect 10.244.192.65 to come from, and infact it’s one above the bottom of the VXLAN.
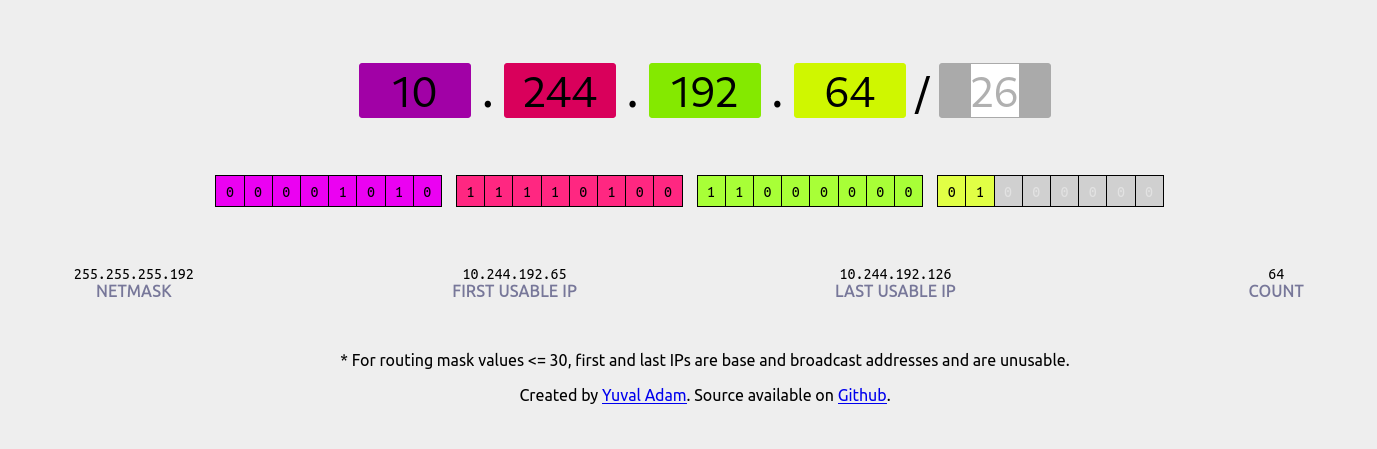
Just to make sure I was doing my CIDR math right (I monstly can only read basic ones like XXX.XXX.YYY.YYY/16) I did check with a handy site cidr.xyz.
Anyway back to that ip route output – since we see that there’s a next hop for 10.244.192.64/26, we know that the IP we’re looking for (10.244.192.65) is not on this machine. Turns out those IPs are on node-2! Here’s what the output of ip routeon node-2 looks like:
root@node-2 ~ # ip route
default via 162.55.94.193 dev enp9s0 proto static onlink
10.244.121.0/26 via 10.244.121.0 dev vxlan.calico onlink
10.244.121.64/26 via 10.244.121.0 dev vxlan.calico onlink
10.244.121.128/26 via 10.244.121.0 dev vxlan.calico onlink
10.244.121.192/26 via 10.244.121.0 dev vxlan.calico onlink
10.244.136.192/26 via 10.244.136.192 dev vxlan.calico onlink
10.244.137.0/26 via 10.244.136.192 dev vxlan.calico onlink
10.244.192.130 dev cali63a741b956a scope link
10.244.192.137 dev calid69c6d15b51 scope link
# ... lots more of individual links
10.244.192.188 dev calief5bb776497 scope link
10.244.192.190 dev cali56c4d6b858e scope link
10.244.206.128/26 via 10.244.206.128 dev vxlan.calico onlink
10.244.206.192/26 via 10.244.206.128 dev vxlan.calico onlink
Great! We’ve found our set of routes! Not too fast though – we found the 10.244.192.XXX range, but there is no 10.244.192.65 in the listing. Is this a case of calico just having bad entries stuck in a routing table somewhere? Restarting calico and calling it a day would be very unsatisfying! Well I tried it and it didn’t work so we must soldier on.
ip routeing 10.244.192.65 directlyInterestingly enough, if I run ip route I get some more interesting output that might be worth looking into:
root@node-6 ~ # ip route get 10.244.192.65
10.244.192.65 dev wireguard.cali table 1 src 10.244.206.130 uid 0
    cache
So calico’s wireguard setup has this entry cached… I don’t really understand the output but before I go look that up, let’s just search for that other IP in there as a pod work load… It’s doing something with the IP we care about:
root@node-6 ~ # ip route get 10.244.206.130
local 10.244.206.130 dev lo table local src 10.244.206.130 uid 0
    cache <local>
Well that new IP (10.244.206.130 is on the same node I was on before! But it looks to be a loopback address… I wonder what this address (and correspondingly, what workload) is tied to? Well I can try and get an idea by using netstat:
root@node-6 ~ # netstat | grep "10.244.206.130"
tcp        0      0 10.244.206.130:42692    10.244.136.218:http     TIME_WAIT
tcp        0      0 10.244.206.130:60000    10.244.137.3:imaps      ESTABLISHED
tcp        0      0 10.244.206.130:39396    10.244.137.3:imaps      ESTABLISHED
tcp        0      0 10.244.206.130:42690    10.244.136.218:http     TIME_WAIT
tcp        0      0 10.244.206.130:60616    10.244.121.167:imaps    ESTABLISHED
tcp        0      0 10.244.206.130:40360    10.244.121.167:imaps    ESTABLISHED
tcp        0      0 10.244.206.130:42686    10.244.136.218:http     TIME_WAIT
tcp        0      0 10.244.206.130:40228    10.244.121.167:imaps    ESTABLISHED
tcp        0      0 10.244.206.130:50210    10.244.192.137:imaps    ESTABLISHED
tcp        0      0 10.244.206.130:50138    10.244.192.137:imaps    ESTABLISHED
tcp        0      0 10.244.206.130:42434    10.244.192.137:imaps    ESTABLISHED
tcp        0      0 10.244.206.130:40280    10.244.121.167:imaps    ESTABLISHED
OK, that’s definitely traefik talking to maddy instances – the reason I know this is because I have a bunch of IngressRouteTCPs that are tied to the main IMAP/S ports, and it makes sense that Traefik would be talking and establishing connections with them. Before running with that theory let’s first ENHANCE the output of netstat to include the program’s name!
tcp        0      0 10.244.206.130:60000    10.244.137.3:993        ESTABLISHED 11326/traefik
tcp        0      0 10.244.206.130:34040    10.244.121.132:80       ESTABLISHED 11326/traefik
tcp        0      0 10.244.206.130:39396    10.244.137.3:993        ESTABLISHED 11326/traefik
tcp        0      0 10.244.206.130:60616    10.244.121.167:993      ESTABLISHED 11326/traefik
tcp        0      0 10.244.206.130:40360    10.244.121.167:993      ESTABLISHED 11326/traefik
tcp        0      0 10.244.206.130:45916    10.244.136.218:80       ESTABLISHED 11326/traefik
tcp        0      0 10.244.206.130:45370    10.244.121.176:3000     ESTABLISHED 11326/traefik
tcp        0      0 10.244.206.130:40228    10.244.121.167:993      ESTABLISHED 11326/traefik
tcp        0      0 10.244.206.130:50210    10.244.192.137:993      ESTABLISHED 11326/traefik
tcp        0      0 10.244.206.130:50138    10.244.192.137:993      ESTABLISHED 11326/traefik
tcp        0      0 10.244.206.130:42434    10.244.192.137:993      ESTABLISHED 11326/traefik
tcp        0      0 10.244.206.130:40280    10.244.121.167:993      ESTABLISHED 11326/traefik
OK! So we may know the thing that is making connections and gumming up the works now! Traefik!?
A comment from the future: It’s not Traefik.
I took a look at the Traefik logs to see if anything would give it away, but nothing does.
---
apiVersion: traefik.containo.us/v1alpha1
kind: IngressRouteTCP
metadata:
  name: haraka-smtp
spec:
  entryPoints:
    - smtp
  routes:
    - kind: Rule
      match: HostSNI(`*`)
      services:
        - name: haraka
          port: 25
Here’s what that SNI looks like:
telnetLet’s take a step back (and fall into another smaller pit). Why not try and make a connection to the mail server via trusty telnet? From my home computer (hint) I get some worrying results:
$ telnet mail.nimbusws.com 25
Trying XXX.XXX.XXX.XXX...
Connection failed: No route to host
Trying YYY.YYY.YYY.YYY...
Connection failed: No route to host
Trying ZZZ.ZZZ.ZZZ.ZZZ...
Connection failed: No route to host
Trying AAA.AAA.AAA.AAA...
telnet: Unable to connect to remote host: Connection timed out
Well, that’s not good. are the servers just completely unreachable? That can’t be the case, because my monitoring hasn’t said anything of the sort, and the sites are run are all still up and happily chugging along! Every once in a while I also get a timeout rather than a no route to host:
$ telnet mail.nimbusws.com 25
Trying XXX.XXX.XXX.XXX...
Connection failed: No route to host
Trying YYY.YYY.YYY.YYY...
Connection failed: Connection timed out
Trying ZZZ.ZZZ.ZZZ.ZZZ...
Very spooky behavior. Maybe maddy is the problem? – I can’t imagine that they’re being crushed under the load, but the machines definitely seem fine and not under heavy load at all so I can rule that out.
Turns out my home ISP here in Tokyo blocks port 25. This is why I could do things like telnet mail.nimbusws.com 587 and it would work perfectly, but surprisingly a no route to host appears for port 25. Using my cellphone network and tethering worked pretty well, along with using the actual nodes to talk to each other.
I noticed also that MXToolbox’s SMTP checking tool was timing out (but crucially resolving the route successfully), so it’s clear that my machine at home is having the problem due to my ISP. Speaking of MXToolbox, they were incredibly helpful in the process…
Here’s what the MXToolbox SMTP checking tool gave me as feedback:
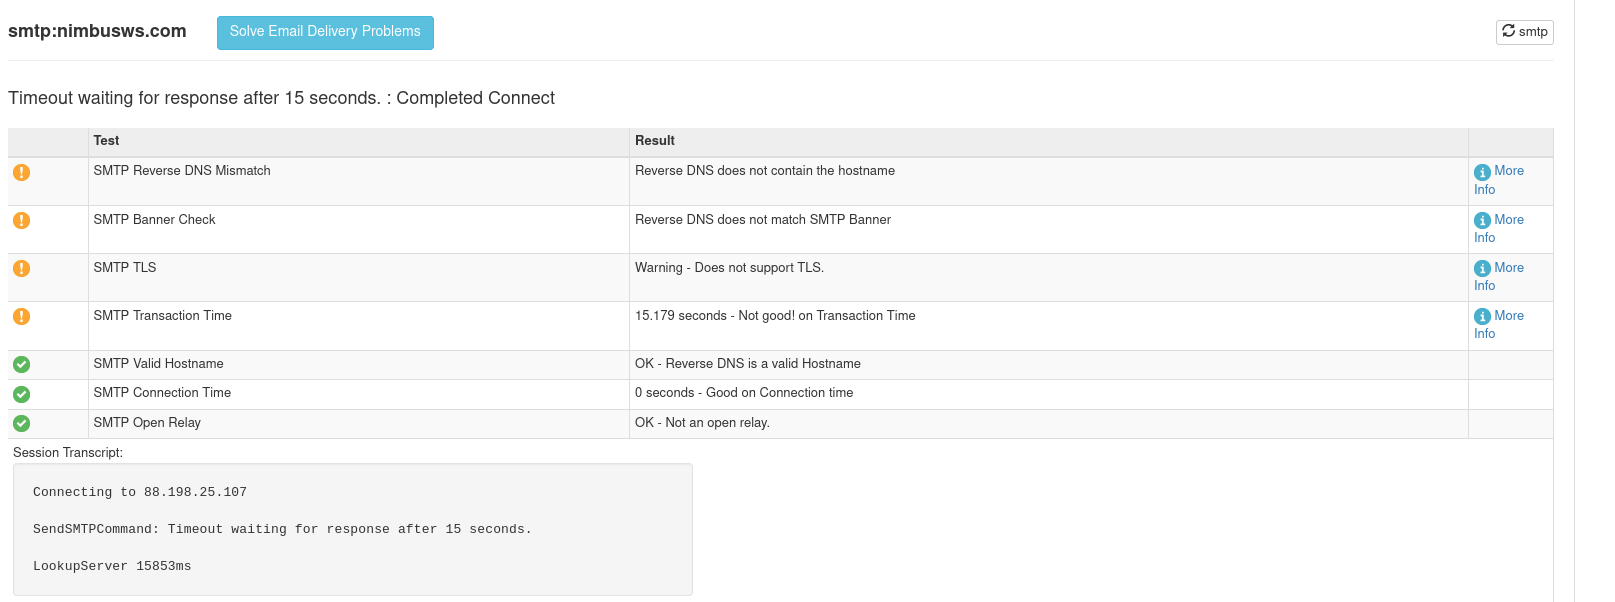
If you click the “More Info” link about the SMTP transaction time that went wrong:
 More Information About Smtp Transaction Time
We were able to connect to your mail server on port 25, but the diagnostic session took longer than expected. This could indicate that your email server is under heavy load.

Here are the levels for which we issue warnings and alerts:

    Over 5 Seconds: Warning
    Over 8 Seconds: Alert

Having this warning on your lookup does not necessarily mean that you will have a problem receiving mail. It is simply a warning that things are less than optimal. This could end up causing users to experience delays with inbound mail.
Additional Information
Tarpitting

It is also possible your server is “Tar pitting.” Tar pitting is a technique used by some email servers to slow down spammers. The idea is that legitimate senders will wait longer to establish a connection than spammers will.

Here is a link to a link to the TechNet article with more information about Tarpitting
Well that helps a lot – so it looks like some things are going right, but others are very much not. The 15.179 seconds makes me feel like the problem is DNS, but a quick check in the relevant pods (kubectl exec -it ....) was enough to confirm that lookups were not failing (ex. between Traefik and Haraka or Haraka and Maddy). While I was there I ran some traceroutes with the fancy ICMP packets that everyone likes sometimes are required. Anyway reachability isn’t the problem.
 - Connected via telnet from a different server (SSH in to server2, telnet to server1) so I could confirm reachability
 - Attempt removing the IngressRouteTCP that I had set up (I *do* need it, the only alternative would be to do a bunch of per-project ingress routes that lead to haraka)
 - Check my IPs for spam/blocklist settings @ zen.spanhaus https://www.spamhaus.org/zen/
 - Tried tons of shit while keeping tcpdump open
   - I know for sure now that traefik is the thing doing the /metrics checks (https://github.com/traefik/traefik/issues/8096)
   - I could turn off the prometheus integration (might be a good project to make it actually a plugin instead?)
 - Tried a completely manual email send through telnet, which works (the email went through haraka to the maddy instance it was supposed to hit, and it was denied because of missing SPF etc which is correct)
   - https://www.ndchost.com/wiki/mail/test-smtp-auth-telnet
   - https://practical365.com/how-to-send-email-via-telnet/
   - https://docs.microsoft.com/en-us/Exchange/mail-flow/test-smtp-with-telnet?view=exchserver-2019
 -
iptables is misconfigured?My googling lead me (astray) to a a thread on CPanel’s forums. I started wondering if maybe my iptables was somehow misconfigured (which would be calico’s fault) – as I’d already checked ufw and it was letting through the right traffic. Running iptables -L n and looking for SMTP gave me this output:
root@node-6 ~ # iptables -L -n | grep ":25"
ACCEPT     tcp  --  0.0.0.0/0            0.0.0.0/0            tcp dpt:25
Nothing seemed wrong to me initially, but I thought maybe I might be missing a rule
A comment from the future: I wasn’t missing a rule
The person in the thread solved their issue was nice enough to state what was wrong:
This issue is solved.

iptables -D INPUT -p tcp --dport 25 -j DROP
iptables -D OUTPUT -p tcp --dport 25 -j DROP
service iptables save
service iptables restart
I don’t need the service stuff but seeing as I was already accepting on 25, maybe I was missing a an outgoing rule? Was it possible that SMTP connections could come in but my server couldn’t speak back?
There’s certainly no NetworkPolicy setup (administered by calico) to prevent outgoing SMTP on the k8s side, and traffic is allowed in ufw so I was skeptical. Anyway after figuring out the commands (and making sure I wasn’t about to make things worse) I ran them, to no avail. didn’t
After telneting to the haraka one one of the nodes from another node (ex. telnet from a shell on node-2 to haraka instance on node-6), I noticed that the normal server side greeting WAS NOT coming back (surprise surprise, what these checks have all been telling me was right all along):
Looking at the Traefik logs:
time="2022-01-16T03:52:50Z" level=error msg="Error during connection: readfrom tcp AAA.AAA.AAA.AAA:41098->10.244.192.183:25: read tcp AAA.AAA.AAA.AAA:25->XXX.XXX.XXX.XXX:10052: read: connection reset by peer"
OK perfect, so Treafik has at least told me where the reques tried to go:
$ k get pods -o=wide --all-namespaces | grep "10.244.192.183"
email                     haraka-8rgq8                                1/1     Running     0          17m     10.244.192.183    node-2.eu-central-1   <none>           <none>
totejo                    fathom-backups-27370080-rn8xs               0/1     Completed   0          27h     10.244.192.183    node-2.eu-central-1   <none>           <none>
ANOTHER overlapping IP? Could this be the reason that it’s happening at all? Unfortunately this isn’t the case because not all nodes have this IP overlap, but all the nodes’ haraka instances are broken.
I need to stop using CronJobs and accelerate my move to sidecar containers (I’ve already started doing this a lot more with newer workloads, totejo is a very old project)… Anyway, after checking for more overlapping IPs from jobs, I looked at the output of Traefik:
$ k logs -f traefik-kqrqs -n ingress | grep error
time="2022-01-16T03:46:35Z" level=error msg="Error during connection: readfrom tcp AAA.AAA.AAA.AAA:55552->10.244.192.183:25: read tcp AAA.AAA.AAA.AAA:25->XXX.XXX.XXX.XXX:52515: read: connection reset by peer"
time="2022-01-16T03:46:50Z" level=error msg="Error during connection: readfrom tcp 10.244.192.65:58256->10.244.206.185:25: read tcp AAA.AAA.AAA.AAA:25->YYY.YYY.YYY.YYY:34887: read: connection reset by peer"
time="2022-01-16T03:48:50Z" level=error msg="Error during connection: readfrom tcp AAA.AAA.AAA.AAA:60514->10.244.192.183:25: read tcp AAA.AAA.AAA.AAA:25->XXX.XXX.XXX.XXX:39903: read: connection reset by peer"
time="2022-01-16T03:49:50Z" level=error msg="Error during connection: readfrom tcp AAA.AAA.AAA.AAA:34476->10.244.192.183:25: read tcp AAA.AAA.AAA.AAA:25->XXX.XXX.XXX.XXX:22273: read: connection reset by peer"
time="2022-01-16T03:50:20Z" level=error msg="Error during connection: readfrom tcp AAA.AAA.AAA.AAA:35566->10.244.192.183:25: read tcp AAA.AAA.AAA.AAA:25->XXX.XXX.XXX.XXX:24527: read: connection reset by peer"
time="2022-01-16T03:50:50Z" level=error msg="Error during connection: readfrom tcp AAA.AAA.AAA.AAA:36666->10.244.192.183:25: read tcp AAA.AAA.AAA.AAA:25->XXX.XXX.XXX.XXX:42992: read: connection reset by peer"
time="2022-01-16T03:52:50Z" level=error msg="Error during connection: readfrom tcp AAA.AAA.AAA.AAA:41098->10.244.192.183:25: read tcp AAA.AAA.AAA.AAA:25->XXX.XXX.XXX.XXX:10052: read: connection reset by peer"
time="2022-01-16T03:59:35Z" level=error msg="Error during connection: readfrom tcp AAA.AAA.AAA.AAA:56172->10.244.192.183:25: read tcp AAA.AAA.AAA.AAA:25->YYY.YYY.YYY.YYY:43713: read: connection reset by peer"
time="2022-01-16T04:01:35Z" level=error msg="Error during connection: readfrom tcp AAA.AAA.AAA.AAA:60560->10.244.192.183:25: read tcp AAA.AAA.AAA.AAA:25->XXX.XXX.XXX.XXX:39892: read: connection reset by peer"
time="2022-01-16T04:02:20Z" level=error msg="Error during connection: readfrom tcp AAA.AAA.AAA.AAA:33960->10.244.192.183:25: read tcp AAA.AAA.AAA.AAA:25->XXX.XXX.XXX.XXX:20185: read: connection reset by peer"
time="2022-01-16T04:02:50Z" level=error msg="Error during connection: write tcp AAA.AAA.AAA.AAA:25->XXX.XXX.XXX.XXX:32566: write: connection reset by peer"
time="2022-01-16T04:03:05Z" level=error msg="Error during connection: readfrom tcp AAA.AAA.AAA.AAA:35628->10.244.192.183:25: read tcp AAA.AAA.AAA.AAA:25->XXX.XXX.XXX.XXX:22512: read: connection reset by peer"
This helped I think… I do get the greeting, but it’s not fast, and I have to press <enter> or submit some input before I see the output from Haraka. It’s almost like Haraka is either intensely delayed or not flushing properly.
Reading through some of the issues in the Harak GitHub repo, I thought I found an issue that might explain the problem I’m facing. The theory here was that haraka was actually delaying the server greeting thanks to this comment.
As I start to run on ideas I get desperate and come up with some wild theories. What if:
Turns out this isn’t the right diagnosis or solution either, even setting the configurables that were related to punishing bad clients (ex. early_talker_delay=0) didn’t help.
Another thing that bothered me was that I didn’t have any resource management in place (requests/limits) for the Haraka DaemonSet. Maybe I was getting hit by containers slowing down due to low QoS?
A quick look at the node and putting in some nice healthy limits also dispelled this notion pretty quickly.
Maybe it’s an issue with PROXY protocol support? I hadn’t been using it at all up until now, if Traefik is expecting it to be turned on for haraka, it isn’t. It was possible that I updated either one and messed up the configuration. After digging into the changelogs just in case, I started reading up on the PROXY protocol v1 and v2 (there is not enough literature out there about the difference):
Turns out this wasn’t the solution either, but I did figure out how to set up PROXY protocol support for Haraka which is a good thing.
Turns out Prometheus was misconfigured to actually try and scrape Haraka – it wasn’t the Treafik instance’s bundled Prometheus (I tried disabling it) at all! Here’s the bad Prometheus configuration (in a ConfigMap):
---
apiVersion: v1
kind: ConfigMap
metadata:
  name: prometheus-config
  namespace: monitoring
data:
  prometheus.yml: |-
    global:
      scrape_interval: 15s

      external_labels:
        monitor: prm-monitor

    scrape_configs:
      - job_name: prometheus
        ## PROBLEM - this kubernetes_sd_config will try and hit endpoints on port 25 that it sees.
        # kubernetes_sd_configs:
        #   - role: endpoints
        # relabel_configs:
        #   - source_labels: [__meta_kubernetes_service_label_app]
        #     separator: ;
        #     regex: prometheus
        #     replacement: $1
        #     action: keep
        static_configs:
          - targets: ["localhost:9090"]

      - job_name: node_exporter
        static_configs:
          - targets: ["node-exporter:9100"]
        ## PROBLEM - this kubernetes_sd_config will try and hit endpoints on port 25 that it sees.
        # kubernetes_sd_configs:
        #   - role: endpoints
        #     namespaces:
        #       names:
        #         - monitoring
        relabel_configs:
          - source_labels: [__meta_kubernetes_endpoints_name]
            regex: 'node-exporter'
            action: keep
          - source_labels: [__meta_kubernetes_service_label_app]
            separator: ;
            regex: node-exporter
            replacement: $1
            action: keep
          - action: labelmap
            regex: __meta_kubernetes_service_label_(.+)
          - source_labels: [__meta_kubernetes_namespace]
            action: replace
            target_label: kubernetes_namespace
          - source_labels: [__meta_kubernetes_service_name]
            action: replace
            target_label: kubernetes_name
          - source_labels: [__meta_kubernetes_node_name]
            action: replace
            target_label: host
          - source_labels: [__meta_kubernetes_service_name]
            separator: ;
            regex: (.*)
            target_label: job
            replacement: ${1}
            action: replace

      - job_name: kube-dns
        static_configs:
          - targets: ["kube-dns.kube-system.svc.cluster.local:9153"]

      - job_name: node-local-dns
        static_configs:
          - targets: ["node-local-dns.kube-system.svc.cluster.local:9253"]
        ## PROBLEM - this kubernetes_sd_config will try and hit endpoints on port 25 that it sees.
        # kubernetes_sd_configs:
        #   - role: endpoints
        #     namespaces:
        #       names:
        #         - kube-system
        # relabel_configs:
        #   - source_labels: [__meta_kubernetes_service_label_k8s_app]
        #     regex: node-local-dns
        #     action: keep

      - job_name: cert-manager
        static_configs:
          - targets: ["cert-manager.cert-manager.svc.cluster.local:9402"]

      - job_name: kube-state-metrics
        static_configs:
          - targets: ["kube-state-metrics.kube-system.svc.cluster.local:8080"]

      - job_name: kubevirt
        static_configs:
          - targets: ["kubevirt-operator.kubevirt.svc.cluster.local:8443"]

      - job_name: traefik
        static_configs:
          - targets: ["traefik.ingress.svc.cluster.local:8080"]
        # kubernetes_sd_configs:
        #   - role: endpoints
        #     namespaces:
        #       names:
        #         - ingress
        relabel_configs:
          - source_labels: [__meta_kubernetes_service_label_app]
            regex: traefik
            action: keep

      # - job_name: linkerd_exporter
      #   scrape_interval: 15s
      #   metrics_path: /admin/metrics/prometheus
      #   static_configs:
      #     - targets: ["l5d.linkerd.svc.cluster.local:9990"]
Once I commented out the stuff above (mostly down to static_configs which aren’t the greatest but do work somewhat), Haraka could breathe again.
So this whole issue was caused by Haraka just being overwhelmed by invalid request by an overzealous prometheus instance. Absolutely bonkers – someone give me my ~10 hours back. After commenting out
Well this wasn’t a fun way to spend a bunch of hours of my life but I did learn a lot – I’ll probably need to do more to harden Haraka before using it in any kind of serious production environment – it got overwhelmed by just a few wrong requests far too easily and stopped delivering mail. Looks like it’s not very DDoS safe, but I guess mail server DDoS is a bit less common.
Anyway, hopefully this investigation and some of the methods/different things I checked helps someone in the future. If you run into the exact same problem as me, definitely send me an email to commiserate.