DDG search drop in powered by ddg.patdryburgh.com
tl;dr - Ceph (Bluestore) (via Rook) on top of ZFS (ZFS on Linux) (via OpenEBS ZFS LocalPV) on top of Kubernetes. It’s as wasteful as it sounds – 200TPS on pgbench compared to ~1700TPS with lightly tuned ZFS and stock Postgres. The setup is at least usable and can get up to 1000TPS (2 replica ceph block pool) with synchronous_commit=off and some other less risky optimizations. Check out the numbers at the end in context and since this post is very Kubernetes heavy, if you don’t run Kubernetes maybe check out the the guide /u/darkz0r2 was kind enough to share.
After some feedback from a reader I've added a section on the commands I used for pgbench! Note that all tests were run on Hetzner, and this post isn't really meant for reproducibility (otherwise I would have included a repo), but I mostly wanted to share at least some of the results I saw!
Yeah so basically, don’t do this. There are lots of reasons to not mix Ceph and ZFS – there are large overlaps in the featuresets of both these technologies. They’re built for different things but the combination of the two can lead to sever performance degradation (if you thought write amplification on one of those solutions was bad…).
As most bad ideas go I set out to drum up some interest on Reddit, and the responses were intriguing – some advice, many well wishers and many faces pre-emptively in palms.
Let’s go into more specifics on why one shouldn’t do what I’m about to do.
Bluestore and ZFS are basically substitute goods in the economic sense for most practical uses. They overlap so much in functionality that it doesn’t make sense to use them together:
So why these two systems distinct in my use case?
The most important place they don’t overlap is high availability – Ceph is the obvious choice as it is synchronously written for both high durability and availability.
I’ve been on a bit of a F/OSS distributed/networked storage system kick lately. Right now I’m running Longhorn on top of a pre-provisioned, hard-coded per-node ZFS ZVol. This means the DaemonSets that are part of the Longhorn application are using a pre-existing ZVOL, mounted to a specific point on disk (ex. /var/data/longhorn), which Longhorn is interacting with as if it were a normal drive, but is actually a synthentic volume powered by ZFS (mediated by OpenEBS ZFS LocalPV).
Longhorn has generally been great to set up, came with great utilities, is run by a great set of maintainers but it’s undeniable that Ceph is currently the industry leader. CERN trusts Ceph, Cloud providers like DigitalOcean run their object storage and block storage (Hetzner) with Ceph, etc. I’m a bit more interested in the object storage capabilities of ceph (and of course the general storage is great too), so I need to see this for myself and see how Ceph would compare to Longhorn, both running on top of ZFS.
Basically I’m chasing a world where I can get the features of ZFS and the HA of Ceph, without a complete collapse in performance, and I want to see what that world is like. As noted previously, the problem is that Ceph’s new awesome file storage engine (Bluestore) overlaps quite heavily with ZFS’s features, so I’m already doing something that’s somewhat verboten and it will be up to me to configure the systems accordingly where possible to make this bad decision a little easier to swallow.
So basically I plan to:
Filestore is the old Ceph storage, and it can actually run much easier on ZFS, and clashes mush less functionality wise. this came up in the reddit thread, but I think it’s better that I avoid building on filestore – I don’t know how much longer filestore is going to be around but I considered running it as a part of the testing but it just isn’t worth it. Bluestore seems to be strictly better than Filestore and the is almost certainly the way moving forward.
The early plan was to do the following:
I think I don’t have to pre-provision the ZVOLs (like with Longhorn) because in this case Rook supports running on Block PVCs if they’re present, but the setup above is pretty obvious – we’re gonna make some PVCs, and then get Rook to use them instead of raw disks.
The write path for RAID1 (mirroring) with 2 copies should look something like this (I’ve fudged lots of corners, so don’t quote me!):
That’s alot of indirection/abstraction layers to shuffle through. Remember when we talked about why this is a bad idea? If you didn’t believe me before I hope you do now.
We’ve covered the feature overlap between ZFS and Ceph, but how would we actually address it? Well surely one of the sides can just… be configured to do less work, if it’s due to be redone later?
The easiest solution is to just disable the parts that are overlapping where they can be, at the higher abstraction level. Both Ceph and ZFS are configurable so we have a different conundrum – which thing to disable?
I haven’t mentioned it until now much but this can actually go both ways – Ceph can run on ZFS and ZFS could run on Ceph. In my case Ceph on ZFS makes more sense because I want ZFS to be the abstraction right above my disks, but I’m open to passionate diatribes about the benefits of having Ceph be the piece of storage infrastructure with access to the metal. I believe that having ZFS down there gives me flexibility – I can use ZFS for direct local manipulation that doesn’t require remote writes, and as far as I remember there’s not really a reasonable way to force ceph to write writes locally (pools with no replicas trigger a warning, so it’s arguable that it’s not really what Ceph is for).
At this point since ZFS is below Ceph, Ceph is probably going to be the easiest to disable overlapping features on. Disabling features on Ceph will be basically forcing it to blindly trust the underlying storage (in this case, ZFS).
Turns out there’s a guide on this! OpenZFS documentation has a small section dedicated to ZFS & Ceph, which I came across thanks to a comment on a GitHub issue. As you might expect there are much more warnings in there about just why doing what I’m about do is a bad idea:
Use a separate journal device. Do not don’t collocate CEPH journal on ZFS dataset if at all possible, this will quickly lead to terrible fragmentation, not to mention terrible performance upfront even before fragmentation (CEPH journal does a dsync for every write).
Use a SLOG device, even with a separate CEPH journal device. For some workloads, skipping SLOG and setting logbias=throughput may be acceptable.
Use a high-quality SLOG/CEPH journal device. A consumer based SSD, or even NVMe WILL NOT DO (Samsung 830, 840, 850, etc) for a variety of reasons. CEPH will kill them quickly, on-top of the performance being quite low in this use. Generally recommended devices are [Intel DC S3610, S3700, S3710, P3600, P3700], or [Samsung SM853, SM863], or better.
If using a high quality SSD or NVMe device (as mentioned above), you CAN share SLOG and CEPH Journal to good results on single device. A ratio of 4 HDDs to 1 SSD (Intel DC S3710 200GB), with each SSD partitioned (remember to align!) to 4x10GB (for ZIL/SLOG) + 4x20GB (for CEPH journal) has been reported to work well.
I’m running afoul of just about every single one of these warnings. I don’t have any of the attached SSDs partitioned for the ZIL/SLOG or ceph journal, they’re all essentially consumer grade, and I’m colocating the Ceph journal and the ZFS dataset. Since this is aproof of concept
Slight more relevant to me, /u/darkz0r2 was kind enough to share a script on Reddit on how he sets up Ceph on ZFS. This is a great guide for those out there who want to try a setup like this but do it properly. Feel free to ignore the Gluster stuff at the bottom!
Since I’m doing this on Kubernetes (the quick and dirty way) there are only a few files that are really interesting/different from the typical Ceph setup as provisioned/managed by Rook:
#
# See:
# - https://github.com/rook/rook/blob/release-1.8/deploy/examples/cluster-on-pvc.yaml
# - https://github.com/rook/rook/blob/master/design/ceph/ceph-config-updates.md
#
---
apiVersion: ceph.rook.io/v1
kind: CephCluster
metadata:
  name: ceph-on-zfs
spec:
  dataDirHostPath: /var/lib/rook

  mon:
    # Set the number of mons to be started. Must be an odd number, and is generally recommended to be 3.
    count: 3

    # The mons should be on unique nodes. For production, at least 3 nodes are recommended for this reason.
    # Mons should only be allowed on the same node for test environments where data loss is acceptable.
    allowMultiplePerNode: false

    # A volume claim template can be specified in which case new monitors (and
    # monitors created during fail over) will construct a PVC based on the
    # template for the monitor's primary storage. Changes to the template do not
    # affect existing monitors. Log data is stored on the HostPath under
    # dataDirHostPath. If no storage requirement is specified, a default storage
    # size appropriate for monitor data will be used.
    volumeClaimTemplate:
      spec:
        storageClassName: localpv-zfs-ceph
        resources:
          requests:
            storage: 10Gi

  cephVersion:
    image: quay.io/ceph/ceph:v16.2.7
    allowUnsupported: false

  skipUpgradeChecks: false

  continueUpgradeAfterChecksEvenIfNotHealthy: false

  mgr:
    count: 1
    modules:
      - name: pg_autoscaler
        enabled: true

  dashboard:
    enabled: true
    # ssl: true

  crashCollector:
    disable: false

  resources:
    prepareosd:
      limits:
        cpu: "200m"
        memory: "200Mi"
      requests:
        cpu: "200m"
        memory: "200Mi"

  disruptionManagement:
    managePodBudgets: true
    osdMaintenanceTimeout: 30
    pgHealthCheckTimeout: 0
    manageMachineDisruptionBudgets: false
    machineDisruptionBudgetNamespace: openshift-machine-api

  storage:
    # when onlyApplyOSDPlacement is false, will merge both placement.All() and storageClassDeviceSets.Placement.
    onlyApplyOSDPlacement: false

    storageClassDeviceSets:
      - name: ceph-on-zfs
        # The number of OSDs to create from this device set
        count: 3

        # IMPORTANT: If volumes specified by the storageClassName are not portable across nodes
        # this needs to be set to false. For example, if using the local storage provisioner
        # this should be false.
        portable: false

        # Certain storage class in the Cloud are slow
        # Rook can configure the OSD running on PVC to accommodate that by tuning some of the Ceph internal
        # Currently, "gp2" has been identified as such
        tuneDeviceClass: false # local ZFS is pretty fast...

        # Certain storage class in the Cloud are fast
        # Rook can configure the OSD running on PVC to accommodate that by tuning some of the Ceph internal
        # Currently, "managed-premium" has been identified as such
        tuneFastDeviceClass: true

        # whether to encrypt the deviceSet or not
        encrypted: false

        # Since the OSDs could end up on any node, an effort needs to be made to spread the OSDs
        # across nodes as much as possible. Unfortunately the pod anti-affinity breaks down
        # as soon as you have more than one OSD per node. The topology spread constraints will
        # give us an even spread on K8s 1.18 or newer.
        placement:
          topologySpreadConstraints:
            - maxSkew: 1
              topologyKey: kubernetes.io/hostname
              whenUnsatisfiable: ScheduleAnyway
              labelSelector:
                matchExpressions:
                  - key: app
                    operator: In
                    values:
                      - rook-ceph-osd

        # (still under storage class deviceset)
        preparePlacement:
          podAntiAffinity:
            preferredDuringSchedulingIgnoredDuringExecution:
              - weight: 100
                podAffinityTerm:
                  labelSelector:
                    matchExpressions:
                      - key: app
                        operator: In
                        values:
                          - rook-ceph-osd
                      - key: app
                        operator: In
                        values:
                          - rook-ceph-osd-prepare
                  topologyKey: kubernetes.io/hostname
          topologySpreadConstraints:
            - maxSkew: 1
              # IMPORTANT: If you don't have zone labels, change this to another key such as kubernetes.io/hostname
              #topologyKey: topology.kubernetes.io/zone
              topologyKey: kubernetes.io/hostname
              whenUnsatisfiable: DoNotSchedule
              labelSelector:
                matchExpressions:
                  - key: app
                    operator: In
                    values:
                      - rook-ceph-osd-prepare

        # (still under stoarge class deviceset)
        # These are the OSD daemon limits. For OSD prepare limits, see the separate section below for "prepareosd" resources
        resources:
          limits:
            cpu: "500m"
            memory: "4Gi"
          requests:
            cpu: "500m"
            memory: "4Gi"

        volumeClaimTemplates:
          - metadata:
              name: ceph-osd-data
              # if you are looking at giving your OSD a different CRUSH device class than the one detected by Ceph
              # annotations:
              #   crushDeviceClass: hybrid
            spec:
              # IMPORTANT: Change the storage class depending on your environment
              storageClassName: localpv-zfs-ceph
              resources:
                requests:
                  storage: 25Gi
              volumeMode: Block
              accessModes:
                - ReadWriteOnce
Note that the code above assumes Rook v1.8. Another file I spent a lot of time editing/tweaking was the
#
# This StorageClass aims to be optimal for Ceph-on-ZFS usage
#
---
apiVersion: storage.k8s.io/v1
kind: StorageClass
metadata:
  name: localpv-zfs-ceph
provisioner: zfs.csi.openebs.io
allowVolumeExpansion: true
volumeBindingMode: WaitForFirstConsumer # required for Ceph mon startup!
parameters:
  volblocksize: "4k" # underlying hard drive
  recordsize: "128k"
  ## Compression implicitly is 'zstd' due to older version of OpenEBS ZFS LocalPV which doesn't support specifying 'zstd'
  # compression: "lz4"
  dedup: "off"
  atime: "off"
  relatime: "on"
  xattr: "sa"
  # Running the FSType as ZFS underneath will give us all the goodies of ZFS without needing to add yet-another layer (ZVOL)
  csi.storage.k8s.io/fstype: "xfs"
  poolname: "tank"
allowedTopologies:
  - matchLabelExpressions:
      - key: storage.zfs
        values:
          - "true"
As far as hiccups I ran into:
Block-mode (not Filesystem mode) PVCs, and xfs is preferred by Ceph so that’s what we use (even though it’s ZFS underneath at the end of the day).WaitForFirstConsumerwas required for the PVCs (the StorageClass above)There were a few hiccups but filling out the resources and messing with the configuration was basically mostly mechanical for me at this point (I had a good place to start as this isn’t my first time running Rook on Kubernetes). Once you’ve got everything to steady state, the rook-ceph namespace (or another namespace if you changed it) looks something like this:
$ k get pods
NAME                                                            READY   STATUS      RESTARTS   AGE
csi-cephfsplugin-6mslw                                          3/3     Running     0          10h
csi-cephfsplugin-7gv45                                          3/3     Running     0          10h
csi-cephfsplugin-8npp2                                          3/3     Running     0          10h
csi-cephfsplugin-klmps                                          3/3     Running     0          10h
csi-cephfsplugin-provisioner-f6f4cc497-76d5z                    6/6     Running     0          10h
csi-cephfsplugin-provisioner-f6f4cc497-89ccq                    6/6     Running     3          10h
csi-rbdplugin-5rkmf                                             3/3     Running     0          10h
csi-rbdplugin-82sgc                                             3/3     Running     0          10h
csi-rbdplugin-fvmjq                                             3/3     Running     0          10h
csi-rbdplugin-provisioner-88c8769c7-7pzh8                       7/7     Running     0          10h
csi-rbdplugin-provisioner-88c8769c7-bwt65                       7/7     Running     4          10h
csi-rbdplugin-vnh9s                                             3/3     Running     0          10h
rook-ceph-crashcollector-node-2.eu-central-1-54b59f4f94-r9xhh   1/1     Running     0          7m22s
rook-ceph-crashcollector-node-5.eu-central-1-865fffcb9c-kchkl   1/1     Running     0          7m17s
rook-ceph-crashcollector-node-6.eu-central-1-7987549b5d-55dd2   1/1     Running     0          7m21s
rook-ceph-mgr-a-679d945bff-w2jtv                                1/1     Running     0          8m3s
rook-ceph-mon-a-7d98f6c475-l246s                                1/1     Running     0          8m35s
rook-ceph-mon-b-68bccf9b9b-xg7tz                                1/1     Running     0          8m36s
rook-ceph-mon-c-59cb5c777c-jdksn                                1/1     Running     0          8m34s
rook-ceph-operator-7bc4985c8d-56z87                             1/1     Running     0          10m
rook-ceph-osd-0-56f4b7b866-hxz2t                                1/1     Running     0          7m22s
rook-ceph-osd-1-75f5cbfbcd-jhqk4                                1/1     Running     0          7m21s
rook-ceph-osd-2-7675f76dcb-j7d5t                                1/1     Running     0          7m17s
rook-ceph-osd-prepare-7250dbb9c4227d092934944df92922c6-rsrf6    0/1     Completed   0          7m42s
rook-ceph-osd-prepare-8430ee747b12c036d92b437f2a7cd8dd-ktbf5    0/1     Completed   0          7m41s
rook-ceph-osd-prepare-e72a7e5dd9c98f7594cf0ed017f13e4a-pjsnt    0/1     Completed   0          7m42s
And if you start the toolbox:
$ make toolbox-bash
kubectl -n rook-ceph exec -it deploy/rook-ceph-tools -- /bin/bash
[rook@rook-ceph-tools-7bbd566fd9-jp4dn /]$ ceph status
  cluster:
    id:     225675a7-bfed-4640-b581-edb7dfcbd5ca
    health: HEALTH_WARN
            1 pool(s) have no replicas configured

  services:
    mon: 3 daemons, quorum a,b,c (age 16m)
    mgr: a(active, since 15m)
    osd: 3 osds: 3 up (since 15m), 3 in (since 16m)

  data:
    pools:   4 pools, 97 pgs
    objects: 3 objects, 57 B
    usage:   17 MiB used, 75 GiB / 75 GiB avail
    pgs:     97 active+clean
That warning is about the one pool that I have configured with zero replication called rook-jbod. After removing it:
$ make toolbox-bash
kubectl -n rook-ceph exec -it deploy/rook-ceph-tools -- /bin/bash
[rook@rook-ceph-tools-7bbd566fd9-jp4dn /]$ ceph status
  cluster:
    id:     225675a7-bfed-4640-b581-edb7dfcbd5ca
    health: HEALTH_OK

  services:
    mon: 3 daemons, quorum a,b,c (age 20m)
    mgr: a(active, since 19m)
    osd: 3 osds: 3 up (since 19m), 3 in (since 19m)

  data:
    pools:   3 pools, 65 pgs
    objects: 2 objects, 38 B
    usage:   17 MiB used, 75 GiB / 75 GiB avail
    pgs:     65 active+clean
And if you check the dashboard:
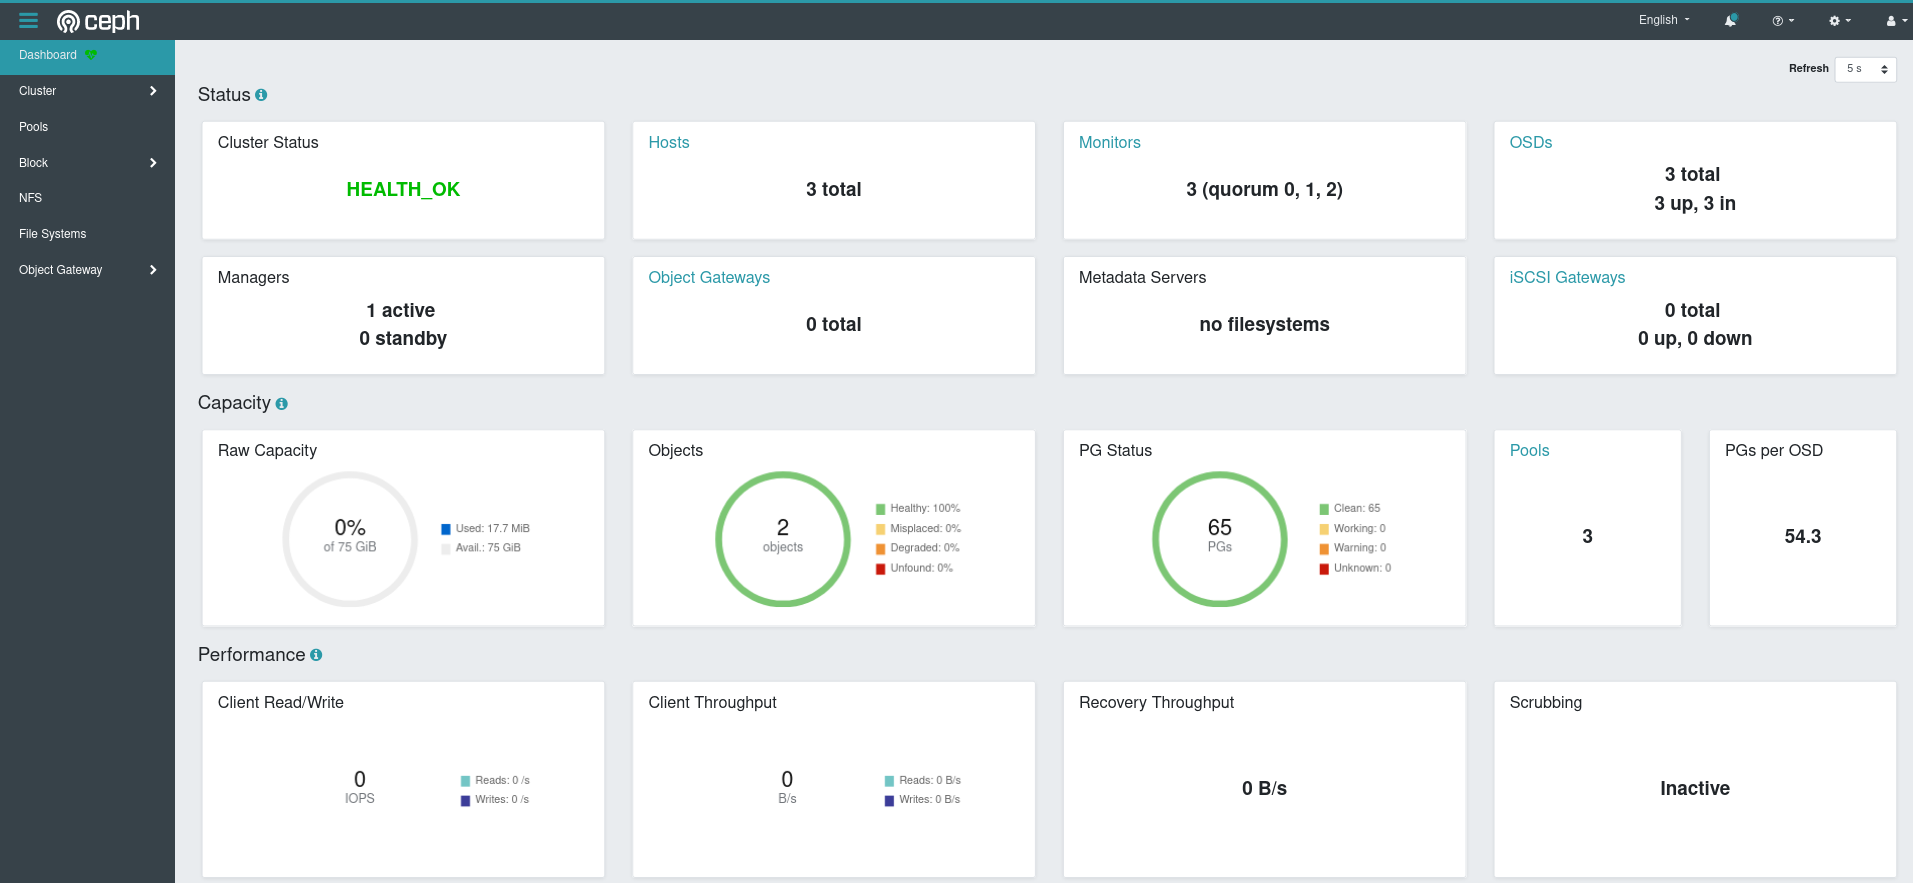
Let’s check if the checksumming is off…
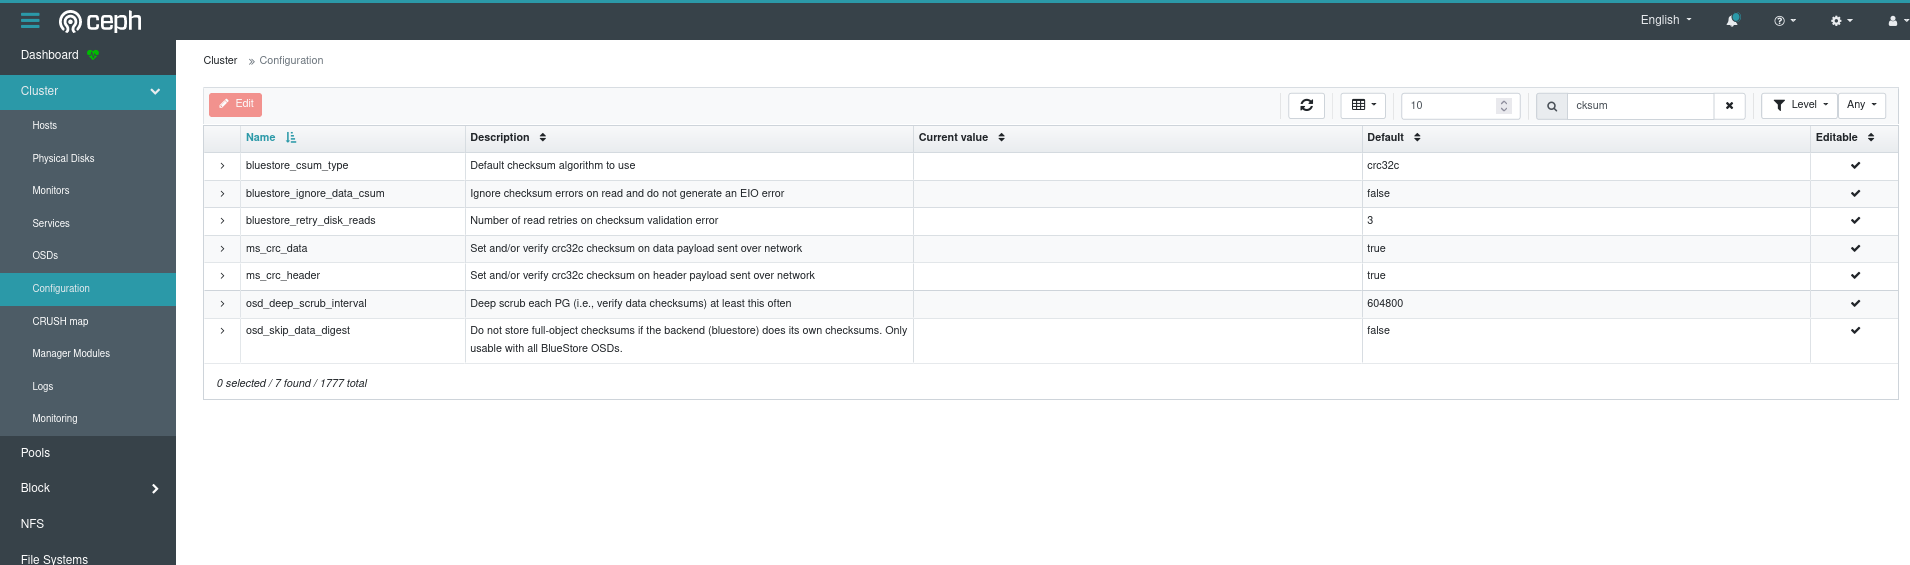
Uh oh looks like the configuration didn’t take quite as we wanted to. But let’s get back to this later! I’m excited to see how pgbench will run.
pgbench configurationHere’s the configuration I used for pgbench, excuse that it’s wrapped up in a Kubernetes Job resource:
# see: https://github.com/longhorn/dbench
---
apiVersion: batch/v1
kind: Job
metadata:
  name: pgbench
  namespace: default
spec:
  backoffLimit: 0
  # activeDeadlineSeconds: 3600
  template:
    spec:
      restartPolicy: Never
      automountServiceAccountToken: false
      initContainers:
        # Wait for postgres to show up
        - name: wait
          image: busybox:latest
          imagePullPolicy: IfNotPresent
          command: ['sh', '-c', 'until nc -vz ${POD_NAME}.${POD_NAMESPACE} 5432; do echo "Waiting for postgres..."; sleep 3; done;']
          env:
            - name: POD_NAME
              value: postgres
            - name: POD_NAMESPACE
              valueFrom:
                fieldRef:
                  fieldPath: metadata.namespace

        # Initialize pg bench database
        - name: init
          image: postgres:14.1-alpine
          imagePullPolicy: IfNotPresent
          command:
            - pgbench
            - --initialize
            - --foreign-keys
            - --scale=1000
          env:
            - name: PGHOST
              value: postgres
            - name: PGUSER
              value: postgres
            - name: PGPASSWORD
              value: postgres

      containers:
        - name: pgbench
          image: postgres:14.1-alpine
          imagePullPolicy: IfNotPresent
          resources:
            requests:
              cpu: 4
              memory: 8Gi
            limits:
              cpu: 4
              memory: 8Gi
          command:
            - pgbench
            - --report-latencies
            - --jobs=4
            - --client=40
            - --time=300
          env:
            - name: PGHOST
              value: postgres
            - name: PGUSER
              value: postgres
            - name: PGPASSWORD
              value: postgres
pgbench runI set up some k8s resources to run pgbench using a PVC supplied by Ceph (via Rook). The StorageClass used will be RAID1 setup (2 copies) and see just how fast it runs! The test was easy to watch from the dashboard:
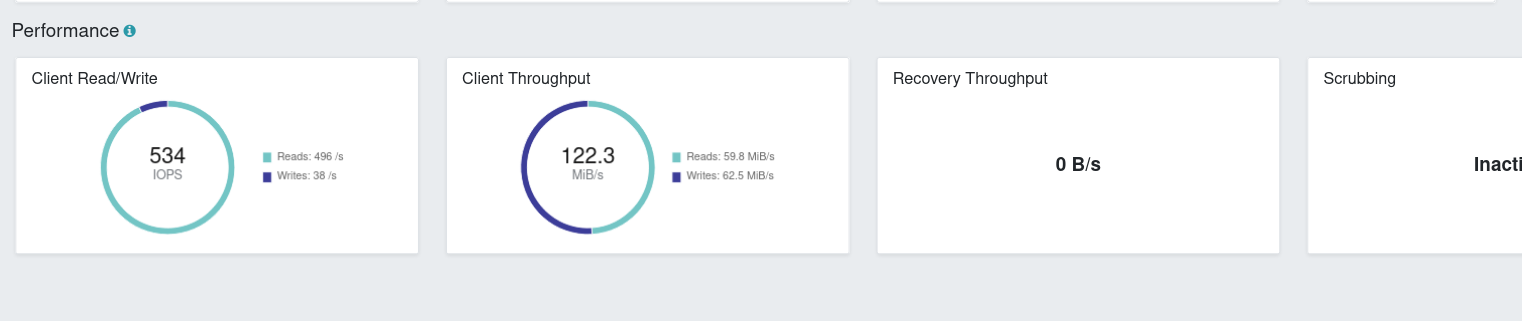
While watching the dashboard move around I saw as “high” as 803 IOPS (7xx reads, <100 writes). Not great (you can’t even get an RDS cluster provisioned IOPS less than 1000 IOPS) but with the inherent waste of the setup I’m glad to see it hit at least that. We also haven’t yet looked into removing the double checksumming/trying to optimize so not a bad place to start. Of course, we’re very far away (way, way below) from the actual capabilities of the underlying hardware.
Heres the end of the output for initialization of pgbench:
...
99800000 of 100000000 tuples (99%) done (elapsed 458.84 s, remaining 0.92 s)
99900000 of 100000000 tuples (99%) done (elapsed 459.22 s, remaining 0.46 s)
100000000 of 100000000 tuples (100%) done (elapsed 459.47 s, remaining 0.00 s)
vacuuming...
creating primary keys...
creating foreign keys...
done in 892.50 s (drop tables 0.00 s, create tables 0.04 s, client-side generate 464.44 s, vacuum 209.43 s, primary keys 180.31 s, foreign keys 38.27 s).
And the output once pgbench actually ran:
$ k logs -f job/pgbench
pgbench (14.1)
starting vacuum...end.
pgbench: error: client 10 script 0 aborted in command 5 query 0: ERROR:  could not read block 96283 in file "base/13756/16404": read only 4224 of 8192 bytes
pgbench: error: client 34 script 0 aborted in command 5 query 0: ERROR:  could not read block 261441 in file "base/13756/16404.1": Bad address
pgbench: error: client 1 script 0 aborted in command 5 query 0: ERROR:  could not read block 66980 in file "base/13756/16404": Bad address
pgbench: error: client 33 script 0 aborted in command 5 query 0: ERROR:  could not read block 103761 in file "base/13756/16404": Bad address
pgbench: pgbench: error: error: client 9 script 0 aborted in command 5 query 0: ERROR:  could not read block 272240 in file "base/13756/16404.2": Bad address
client 19 script 0 aborted in command 5 query 0: ERROR:  could not read block 146609 in file "base/13756/16404.1": Bad address
pgbench: error: client 37 script 0 aborted in command 5 query 0: ERROR:  could not read block 242121 in file "base/13756/16404.1": Bad address
pgbench: error: pgbench: error: client 15 script 0 aborted in command 5 query 0: ERROR:  could not read block 69293 in file "base/13756/16404": Bad address
client 3 script 0 aborted in command 5 query 0: ERROR:  could not read block 64169 in file "base/13756/16404": Bad address
pgbench: error: client 36 script 0 aborted in command 5 query 0: ERROR:  could not read block 88786 in file "base/13756/16404": Bad address
pgbench: error: client 16 script 0 aborted in command 5 query 0: ERROR:  could not read block 254039 in file "base/13756/16404.1": Bad address
pgbench: error: pgbench: error: client 39 script 0 aborted in command 5 query 0: ERROR:  could not read block 139592 in file "base/13756/16404.1": Bad address
client 4 script 0 aborted in command 5 query 0: ERROR:  could not read block 69032 in file "base/13756/16404": Bad address
pgbench: error: client 17 script 0 aborted in command 5 query 0: ERROR:  could not read block 46228 in file "base/13756/16404": Bad address
pgbench: error: client 29 script 0 aborted in command 5 query 0: ERROR:  could not read block 138865 in file "base/13756/16404.1": Bad address
pgbench: error: client 5 script 0 aborted in command 5 query 0: ERROR:  could not read block 157791 in file "base/13756/16404.1": Bad address
pgbench: error: client 18 script 0 aborted in command 5 query 0: ERROR:  could not read block 39901 in file "base/13756/16404": Bad address
pgbench: error: client 6 script 0 aborted in command 5 query 0: ERROR:  could not read block 112582 in file "base/13756/16404": Bad address
pgbench: error: client 7 script 0 aborted in command 5 query 0: ERROR:  could not read block 62002 in file "base/13756/16404": Bad address
pgbench: error: client 8 script 0 aborted in command 5 query 0: ERROR:  could not read block 227032 in file "base/13756/16404.1": Bad address
pgbench: error: client 2 script 0 aborted in command 5 query 0: ERROR:  could not read block 123751 in file "base/13756/16404": Bad address
pgbench: error: client 27 script 0 aborted in command 5 query 0: ERROR:  could not read block 202213 in file "base/13756/16404.1": Bad address
pgbench: error: client 22 script 0 aborted in command 5 query 0: ERROR:  could not read block 59944 in file "base/13756/16404": Bad address
pgbench: error: client 38 script 0 aborted in command 5 query 0: ERROR:  could not read block 12051 in file "base/13756/16404": Bad address
pgbench: error: client 20 script 0 aborted in command 5 query 0: ERROR:  could not read block 59586 in file "base/13756/16404": Bad address
pgbench: pgbench:pgbench: error:  client 32 script 0 aborted in command 5 query 0: ERROR:  could not read block 141604 in file "base/13756/16404.1": Bad address
error: error: client 0 script 0 aborted in command 5 query 0: ERROR:  could not read block 224083 in file "base/13756/16404.1": Bad address
client 12 script 0 aborted in command 5 query 0: ERROR:  could not read block 227347 in file "base/13756/16404.1": Bad address
pgbench: error: client 23 script 0 aborted in command 5 query 0: ERROR:  could not read block 98306 in file "base/13756/16404": Bad address
pgbench: error: pgbench: error: client 30 script 0 aborted in command 5 query 0: ERROR:  could not read block 159243 in file "base/13756/16404.1": Bad address
client 11 script 0 aborted in command 5 query 0: ERROR:  could not read block 21271 in file "base/13756/16404": Bad address
pgbench: error: client 24 script 0 aborted in command 5 query 0: ERROR:  could not read block 255084 in file "base/13756/16404.1": Bad address
pgbench: error: client 31 script 0 aborted in command 5 query 0: ERROR:  could not read block 166539 in file "base/13756/16404.1": Bad address
pgbench: error: client 13 script 0 aborted in command 5 query 0: ERROR:  could not read block 145356 in file "base/13756/16404.1": Bad address
pgbench: error: client 25 script 0 aborted in command 5 query 0: ERROR:  could not read block 25645 in file "base/13756/16404": Bad address
pgbench: error: client 26 script 0 aborted in command 5 query 0: ERROR:  could not read block 141343 in file "base/13756/16404.1": Bad address
pgbench: error: client 35 script 0 aborted in command 5 query 0: ERROR:  could not read block 157813 in file "base/13756/16404.1": Bad address
pgbench: error: client 14 script 0 aborted in command 5 query 0: ERROR:  could not read block 189722 in file "base/13756/16404.1": Bad address
pgbench: error: client 21 script 0 aborted in command 5 query 0: ERROR:  could not read block 217253 in file "base/13756/16404.1": Bad address
pgbench: error: client 28 script 0 aborted in command 5 query 0: ERROR:  could not read block 180584 in file "base/13756/16404.1": Bad address
transaction type: <builtin: TPC-B (sort of)>
scaling factor: 1000
query mode: simple
number of clients: 40
number of threads: 4
duration: 300 s
number of transactions actually processed: 1231
pgbench: fatal: Run was aborted; the above results are incomplete.
latency average = 36.432 ms
initial connection time = 89.884 ms
tps = 1097.924913 (without initial connection time)
statement latencies in milliseconds:
         0.001  \set aid random(1, 100000 * :scale)
         0.001  \set bid random(1, 1 * :scale)
         0.001  \set tid random(1, 10 * :scale)
         0.000  \set delta random(-5000, 5000)
         0.660  BEGIN;
         1.334  UPDATE pgbench_accounts SET abalance = abalance + :delta WHERE aid = :aid;
         0.873  SELECT abalance FROM pgbench_accounts WHERE aid = :aid;
         0.968  UPDATE pgbench_tellers SET tbalance = tbalance + :delta WHERE tid = :tid;
         1.506  UPDATE pgbench_branches SET bbalance = bbalance + :delta WHERE bid = :bid;
         0.955  INSERT INTO pgbench_history (tid, bid, aid, delta, mtime) VALUES (:tid, :bid, :aid, :delta, CURRENT_TIMESTAMP);
        29.517  END;
Uh oh, disaster has struck. We’re getting some data corruption. This actually came up in the past in the post I did on everything I’ve seen for optimizing Postgres on ZFS, but the resolutions that applied then are still in place!
Yup, all my servers still have the drive-level volatile write caching disabled:
# nvme get-feature -f 6 /dev/nvme0n1
get-feature:0x6 (Volatile Write Cache), Current value:0x000001
Yeah the lower level volatile write cache is definitely not off at the disk level.
Well the only thing I can think of possibly being an issue should be detected default fdatasync set for wal_sync_method. With recent kernels it resolves to fdatasync but I’ve had problems with the past (which are resolved by forcing wal_sync_method=fsync so I think I’ll give that a shot and try again…
Second time around I’m getting some nice IOPS numbers:
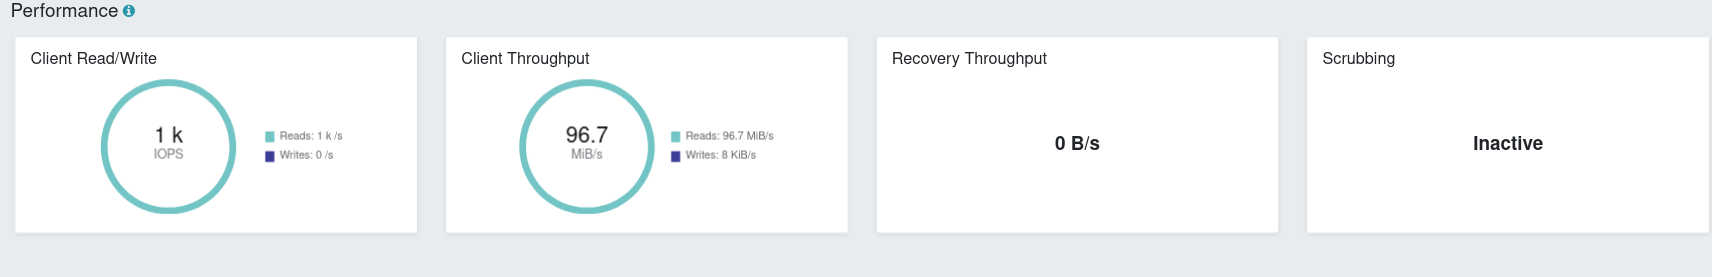
Looks like it’s taking much longer to init:
...
100000000 of 100000000 tuples (100%) done (elapsed 991.46 s, remaining 0.00 s)
vacuuming...
creating primary keys...
creating foreign keys...
done in 1382.26 s (drop tables 0.00 s, create tables 0.12 s, client-side generate 997.58 s, vacuum 161.32 s, primary keys 183.83 s, foreign keys 39.41 s).
And for the actual output of the run…
[frodo|default] mrman 14:08:32 [ceph-on-zfs] $ k logs pgbench-hxt4f
pgbench (14.1)
starting vacuum...end.
transaction type: <builtin: TPC-B (sort of)>
scaling factor: 1000
query mode: simple
number of clients: 40
number of threads: 4
duration: 300 s
number of transactions actually processed: 71424
latency average = 168.066 ms
initial connection time = 118.385 ms
tps = 238.002372 (without initial connection time)
statement latencies in milliseconds:
         0.001  \set aid random(1, 100000 * :scale)
         0.001  \set bid random(1, 1 * :scale)
         0.001  \set tid random(1, 10 * :scale)
         0.000  \set delta random(-5000, 5000)
         0.805  BEGIN;
        28.501  UPDATE pgbench_accounts SET abalance = abalance + :delta WHERE aid = :aid;
         1.131  SELECT abalance FROM pgbench_accounts WHERE aid = :aid;
        27.944  UPDATE pgbench_tellers SET tbalance = tbalance + :delta WHERE tid = :tid;
        15.730  UPDATE pgbench_branches SET bbalance = bbalance + :delta WHERE bid = :bid;
        14.683  INSERT INTO pgbench_history (tid, bid, aid, delta, mtime) VALUES (:tid, :bid, :aid, :delta, CURRENT_TIMESTAMP);
        79.308  END;
Good news, no corruption! Bad news, absolutely terrible TPS. As you might expect, synchronous writes mean quite a bit more latency – the average being ~168ms which is pretty high considering these two servers are “right next to each other”.
We’ve a long way to go as far as optimization goes (we’ve done none so far), and maybe it just doesn’t make much sense to do this in this way. It’s arguable that a database is precisely not the right thing to run on kind of setup (considering I don’t have access to fiber and a big SAN), but I think the data still carries some meaning. At the very least we know just how bad the naive approach will do.
OK so ~200TPS is pretty bad. Underneath we know the writes are going to a ZVOL with all the goodies of ZFS transparently available so maybe we can actually re-enable of the ZFS related optimizations that we made in the post about Postgres? In particular:
synchronous_commit=offfull_page_writes=offwal_init_zero=offwal_recycle=offpgbench re-runWith the ZFS optimizations applied:
pgbench (14.1)
starting vacuum...end.
transaction type: <builtin: TPC-B (sort of)>
scaling factor: 1000
query mode: simple
number of clients: 40
number of threads: 4
duration: 300 s
number of transactions actually processed: 418864
latency average = 28.642 ms
initial connection time = 98.567 ms
tps = 1396.556798 (without initial connection time)
statement latencies in milliseconds:
         0.001  \set aid random(1, 100000 * :scale)
         0.001  \set bid random(1, 1 * :scale)
         0.001  \set tid random(1, 10 * :scale)
         0.000  \set delta random(-5000, 5000)
         0.624  BEGIN;
        22.312  UPDATE pgbench_accounts SET abalance = abalance + :delta WHERE aid = :aid;
         0.871  SELECT abalance FROM pgbench_accounts WHERE aid = :aid;
         2.243  UPDATE pgbench_tellers SET tbalance = tbalance + :delta WHERE tid = :tid;
         0.891  UPDATE pgbench_branches SET bbalance = bbalance + :delta WHERE bid = :bid;
         0.997  INSERT INTO pgbench_history (tid, bid, aid, delta, mtime) VALUES (:tid, :bid, :aid, :delta, CURRENT_TIMESTAMP);
         0.689  END;
Awesome we’re back up to ~1300 TPS!
And once again just to make sure:
pgbench (14.1)
starting vacuum...end.
transaction type: <builtin: TPC-B (sort of)>
scaling factor: 1000
query mode: simple
number of clients: 40
number of threads: 4
duration: 300 s
number of transactions actually processed: 453943
latency average = 26.437 ms
initial connection time = 103.577 ms
tps = 1513.007884 (without initial connection time)
statement latencies in milliseconds:
         0.001  \set aid random(1, 100000 * :scale)
         0.001  \set bid random(1, 1 * :scale)
         0.001  \set tid random(1, 10 * :scale)
         0.000  \set delta random(-5000, 5000)
         0.622  BEGIN;
        19.970  UPDATE pgbench_accounts SET abalance = abalance + :delta WHERE aid = :aid;
         0.881  SELECT abalance FROM pgbench_accounts WHERE aid = :aid;
         2.254  UPDATE pgbench_tellers SET tbalance = tbalance + :delta WHERE tid = :tid;
         0.986  UPDATE pgbench_branches SET bbalance = bbalance + :delta WHERE bid = :bid;
         1.015  INSERT INTO pgbench_history (tid, bid, aid, delta, mtime) VALUES (:tid, :bid, :aid, :delta, CURRENT_TIMESTAMP);
         0.687  END;
OK, about 1500 TPS this time, and I still haven’t done any Ceph-side optimization. Considering Longhorn was doing ~1000TPS while consuming quite a bit of CPU this is great news. In fact this news is so good it makes me question whether I’m being too optimistic. Let’s go over the reasoning (again) of why the options I’ve picked aren’t completely impractical for a “real” Postgres workload:
synchronous_commit=off
synchronous_commit when needed.full_page_writes=off
wal_init_zero=off / wal_recycle=off
It would be nice to know what kind of performance we get with synchronous_commit enabled by default (as it would be if I were using this setup for NimbusWS for example) so let’s see:
pgbench (14.1)
starting vacuum...end.
transaction type: <builtin: TPC-B (sort of)>
scaling factor: 1000
query mode: simple
number of clients: 40
number of threads: 4
duration: 300 s
number of transactions actually processed: 134514
latency average = 89.218 ms
initial connection time = 101.130 ms
tps = 448.338449 (without initial connection time)
statement latencies in milliseconds:
         0.001  \set aid random(1, 100000 * :scale)
         0.001  \set bid random(1, 1 * :scale)
         0.001  \set tid random(1, 10 * :scale)
         0.000  \set delta random(-5000, 5000)
         0.718  BEGIN;
         1.177  UPDATE pgbench_accounts SET abalance = abalance + :delta WHERE aid = :aid;
         0.910  SELECT abalance FROM pgbench_accounts WHERE aid = :aid;
         1.077  UPDATE pgbench_tellers SET tbalance = tbalance + :delta WHERE tid = :tid;
         2.516  UPDATE pgbench_branches SET bbalance = bbalance + :delta WHERE bid = :bid;
         0.935  INSERT INTO pgbench_history (tid, bid, aid, delta, mtime) VALUES (:tid, :bid, :aid, :delta, CURRENT_TIMESTAMP);
        81.897  END;
Yup, that’s not great – ~400TPS (which at least is better than ~200!), pitiful performance given that we’re running on two SSDs at the end of the day, but at least we know just where we stand with the naive approach.
NOTE Don’t do this – as mqudsi noted on Reddit, if your server lacks ECC RAM, the Ceph <-> ZFS layer is susceptible to corruption and should be left protected via the checksums at the Ceph level.
Turning of checksums at the Ceph level is both dangerous and doesn’t appreciably change performance.
One thing that we noted earlier that was broken is that checksums are indeed still happening. Since we’re running on ZFS, we know that the bottom layer will not lose data, so it’s more than likely safe to turn off the “double work” Bluestore is doing checksumming.
Turning it off manually is pretty easy via the Ceph dashboard so I’ll do that first, and going forward bake it in via the ceph-override-config.
pgbench re-runWith the checksums disabled and the ZFS optimizations re-applied (including synchronous_commit=off):
kubectl logs job/pgbench
pgbench (14.1)
starting vacuum...end.
transaction type: <builtin: TPC-B (sort of)>
scaling factor: 1000
query mode: simple
number of clients: 40
number of threads: 4
duration: 300 s
number of transactions actually processed: 464944
latency average = 25.812 ms
initial connection time = 94.121 ms
tps = 1549.647392 (without initial connection time)
statement latencies in milliseconds:
         0.001  \set aid random(1, 100000 * :scale)
         0.001  \set bid random(1, 1 * :scale)
         0.001  \set tid random(1, 10 * :scale)
         0.000  \set delta random(-5000, 5000)
         0.608  BEGIN;
        19.765  UPDATE pgbench_accounts SET abalance = abalance + :delta WHERE aid = :aid;
         0.865  SELECT abalance FROM pgbench_accounts WHERE aid = :aid;
         2.007  UPDATE pgbench_tellers SET tbalance = tbalance + :delta WHERE tid = :tid;
         0.897  UPDATE pgbench_branches SET bbalance = bbalance + :delta WHERE bid = :bid;
         0.976  INSERT INTO pgbench_history (tid, bid, aid, delta, mtime) VALUES (:tid, :bid, :aid, :delta, CURRENT_TIMESTAMP);
         0.674  END;
OK, not much of a change there so it looks like it’s not worth worrying about whether checksums are disabled too much.
Here’s a table of some best-of-two-runs pgbench results across various storage paradigms that I have set up right now (which are accessible in tandem):
| Setup | TPS | Avg Latency (ms) |
|---|---|---|
ZFS (recordsize=8k, compression=zstd, pg shared_buffers=8GB) |
4048 | 9 |
ZFS (recordsize=8k, compression=zstd) |
3178 | 12 |
mdadm |
2348 | 17 |
Ceph-on-ZFS RAID1 (recordsize=128k, pg synchronous_commit=off) |
1513 | 26 |
Longhorn (wal_sync_method=fsync) |
737 | 54 |
Ceph-on-ZFS RAID1 (synchronous_commit=on, other ZFS optimizations) |
448 | 89 |
| Ceph-on-ZFS RAID1 (default) | 238 | 168 |
NOTE All postgres instances used for the numbers above had 4vCores and 16GB of RAM.
As always, take your prerequisite salt! The benchmarks are really really disparate systems, and I use them more to tell me how far a completely naive implementation gets me, compared to what I know is possible with “plain” ZFS underneath and more production-appropriate settings. Even the production appropriate settings which are making about 4k TPS could be improved upon. The expectation was always that Ceph on ZFS would perform badly compared to “plain” ZFS, but I’m glad to find out just how badly, and how workable it is.
There are a lot more angles worth checking out here, but I don’t think I’ve ever seen a table with these data points on the internet before, so I’ll leave it here for today, I do need to get back to work building Nimbus.
If you’re interested in seeing some setups that are interesting but aren’t written here, please let me know or send me your own experiments! If you want me to do the experiments, get in touch and and we’ll figure something out (I’d probably do it if you only donated the material cost, as long as you are flexible on time!).
Here are at least some of hte places where more optimization is needed:
mkfs options match properly. Similar to the tuning of ceph as far as partitioning the ZIL/SLOG and Ceph journal but different.PersistentVolumeClaims at the problem, more partitioning needed to happenbtrfs?
btrfs works great with Ceph but this seems to be in the Filestore days… See the notes section of OS recommendationsIf you (yes you!) have some ideas on some improvements or noticed anything I did obviously and blatantly wrong, please reach out and let me know!
Thanks for coming along for the ride – looks like Ceph on ZFS is just about as bad as you might expect simply hearing about it. I was surprised to find that turning off the checksumming on the Bluestore side didn’t really make a difference.
That said, Ceph on ZFS is actully not half bad from a pure capability standpoint, especially when compared to Longhorn. Even in a massively unoptimized naive case, being able to drive 1000TPS (admittedly for synthetic pgbench workload, under a very questionable optimization like synchronous_commit=off) leaves me a lot of space with workloads that are nowhere near as demanding. The CPU requirements are also much easier to tune than Longhorn and the synchronous multi-machine durability that Ceph provides is obviously a draw.
Of course, with Ceph on ZFS I’ve gained access to what I really wanted – the advanced features of Ceph for when I don’t have a performance-sensitive workload – CephFS and Object Storage will be great to use around the cluster for little projects.
I’ll be tweaking and optimizing the setup as time goes and will do another writeup when I find time to really dig in and do some more tweaking – there’s a lot more to do.