DDG search drop in powered by ddg.patdryburgh.com
tl;dr - I started trying to set up EFK (Elastic, FluentD, Kibana), and hit frustrating integration issues/bugs with Elastic+Kibana 6.x, tripped myself up a LOT, almost gave up and went with Graylog, but then rallied to finish setting everything up by basically fixing my own bad configuration. Skip to the TLDR section for the hand-written working k8s configuration.
This is Part 2 in a series of blog posts where I seek to increase observability on my single-node Kubernetes cluster. While the scale isn’t large, it’s perfect for learning how to run better operations. In particular, this post will cover adding the EFKK stack (Elastic search, FluentD, Kibana on Kubernetes) my tiny cluster, and getting an application to start sending logs.
There are lots of ways to do what I’m attempting to do, for example:
I chose to go with the EFKK stack for monitoring because I’d like to try out FluentD, and I’m building it manually intead of using the addon code so I can get a feel for the pieces myself (if but a little). What I lose in time I’m hoping I will gain in understanding/insight into these systems and Kubernetes adminisration at large.
A note on why I didn’t use Graylog: I’ve used Graylog in the past and didn’t want to use it again here just because it was kind of heavy (including all it’s requisite components like Mongo and Elastic Search itself). The resource requirements for Graylog are surprisingly hard to find as well despite very good official documentation. The only indication of hardware requirements I’ve found is a blurb on the OpenStack Installation docs that suggest you reserve at least 4GB for the instance.
As Graylog would most likely be IO bound rather than CPU bound I’m sure you could get away with 1 or 2 physical cores. In the past I’ve had issues trying to run Graylog using Docker Compose on a smallish 2-physical-core VM, and it just failed kind of silently (had to go find spelunking through logs, rather than the container exiting or failing obviously). So for now, I’m exploring other options, though I love that Graylog has tried to reduce the number of things you need to get together to watch logs.
As this post is a series, it’s good to keep in mind that logging is just one small piece of application “observability” and I haven’t heard too much belly-aching about any of these tools – they’re the trusted go-to’s of the current day and age. Without further ado, let’s get into it.
As always, the first thing to do is to read up on the technology involved and get an intuition for how they work together and what they ought to be doing. This helps in building and maintaining a mental model of the system, which of course is very useful when debugging and maintaining the system in general.
There are various resources on the web that will teach you abou tthe EFKK stack (you could even start with learning about the ELK stack), here are a few that I’ve looked up:
The flow we’re trying to facilitate here is the following:
The first step is to get FluentD running on the Kubernetes cluster. At present I opt for manual resource definition file writing over tools like Helm. Since I’ll want FluentD to be collecting logs from just about every node (as nodes will be running pods Pods), a DaemonSet is the right Kubernetes abstraction.
I’m choosing to put this FluentD instance in a Kubernetes Namespace called monitoring. As I’m only one developer, and it’s a relatively small cluster, I’m likely going to share that monitoring namespace across multiple applications that are actually deployed on my cluster. The resource definition is the usual:
apiVersion: v1
kind: Namespace
metadata:
    name: monitoring
Now that we’ve got our namespace, it would be good to set up the ServiceAccount that the DaemonSet will act as, enabling us to limit/increase what it can do through RBAC.
---
apiVersion: v1
kind: ServiceAccount
metadata:
  name: fluentd
  namespace: monitoring
I’m not 100% sure which special permissions will be needed (if any) for FluentD but it makes sense to make a ServiceAccount for the DaemonSet if only to prevent it from trying to use the one provided by the monitoring namespace by default.
Now, Let’s get FluentD up and running. Since I’ll be running FluentD as a container, the FluentD DockerHub page is where I need to look for the various options. Here’s what I ended up with:
---
apiVersion: apps/v1
kind: DaemonSet
metadata:
  name: fluentd
  namespace: monitoring
  labels:
    name: default-fluentd
    app: fluentd
    resource: logs
spec:
  selector:
    matchLabels:
      app: fluentd
      tier: logging
  template:
    metadata:
      labels:
        app: fluentd
        tier: logging
        resource: logs
      annotations:
        scheduler.alpha.kubernetes.io/critical-pod: '' # logging's pretty important
    spec:
      serviceAccountName: fluentd
      terminationGracePeriodSeconds: 120
      containers:
      - name: fluentd
        image: fluent/fluentd:v0.12.42
        ports:
        - containerPort: 24224
          hostPort: 24224
          protocol: UDP
        - containerPort: 24224
          hostPort: 24224
          protocol: TCP
        volumeMounts:
          - mountPath: /fluentd/log
            name: fluentd-logs
      volumes:
      - name: fluentd-logs
        hostPath:
          path: /var/app/fluentd/log
One thing you’ll notice here is that I’ve used a hostPath type volume here instead of something like a PersistentVolumeClaim. While I initially thought to use a PVC (because I Just recently got Rook working and want to use it more), it makes much more sense to use only a hostPath type volume since logs are ephemeral and I’m not too worried about storing them long term yet. While writing this configuration, there was a bit of back and forth and checking so don’t feel bad if you don’t get it right in the first try, I certainly didn’t.
Here’s what the output looks like after the Pod that belongs to the DaemonSet has come up:
$ k get pods -n monitoring
NAME            READY     STATUS    RESTARTS   AGE
fluentd-n2rsl   1/1       Running   0          42s
Let’s check out the logs just to make sure nothing’s eggregiously wrong:
$ k logs fluentd-n2rsl -n monitoring
2018-02-23 15:04:24 +0000 [info]: reading config file path="/fluentd/etc/fluent.conf"
2018-02-23 15:04:24 +0000 [info]: starting fluentd-0.12.42
2018-02-23 15:04:24 +0000 [info]: gem 'fluentd' version '0.12.42'
2018-02-23 15:04:24 +0000 [info]: adding match in @mainstream pattern="docker.**" type="file"
2018-02-23 15:04:24 +0000 [info]: adding match in @mainstream pattern="**" type="file"
2018-02-23 15:04:24 +0000 [info]: adding filter pattern="**" type="stdout"
2018-02-23 15:04:24 +0000 [info]: adding source type="forward"
2018-02-23 15:04:24 +0000 [info]: using configuration file: <ROOT>
  <source>
    @type forward
    @id input1
    @label @mainstream
    port 24224
  </source>
  <filter **>
    @type stdout
  </filter>
  <label @mainstream>
    <match docker.**>
      @type file
      @id output_docker1
      path /fluentd/log/docker.*.log
      symlink_path /fluentd/log/docker.log
      append true
      time_slice_format %Y%m%d
      time_slice_wait 1m
      time_format %Y%m%dT%H%M%S%z
      buffer_path /fluentd/log/docker.*.log
    </match>
    <match **>
      @type file
      @id output1
      path /fluentd/log/data.*.log
      symlink_path /fluentd/log/data.log
      append true
      time_slice_format %Y%m%d
      time_slice_wait 10m
      time_format %Y%m%dT%H%M%S%z
      buffer_path /fluentd/log/data.*.log
    </match>
  </label>
</ROOT>
2018-02-23 15:04:24 +0000 [info]: listening fluent socket on 0.0.0.0:24224
OK, some pretty reasonable loooking defaults there! There are no sinks (basically, places for the logs to go), but for now it’s started and I’m happy.
It’s good practice to configure resource limits on k8s pods – while I’m sure fluentd will be well behaved, it’s my first time running it, and I don’t want it to chew up all my resources… Here are some hastily put together resource limits:
 #... the other stuff ...
      containers:
      - name: fluentd
        image: fluent/fluentd:v0.12.42
        resources:
          limits:
            cpu: "2"
            memory: "1Gi"
        ports:
 #... the other stuff ...
One note about reachability: since fluentd is running as a DaemonSet (one every node), it makes sense to use a NodeIP to connect to it. I currently have a convention of naming my nodes as their IPs, so this will work nicely as input into apps that need to be configured to know where fluentd is. An excellent post on this topic was within easy reach on Google.
Let’s spin up a test container and see if we can at least curl fluentd:
$ k run --rm -it --image=alpine test-fluentd
If you don't see a command prompt, try pressing enter.
/ # apk --update add curl
fetch http://dl-cdn.alpinelinux.org/alpine/v3.7/main/x86_64/APKINDEX.tar.gz
fetch http://dl-cdn.alpinelinux.org/alpine/v3.7/community/x86_64/APKINDEX.tar.gz
(1/3) Installing ca-certificates (20171114-r0)
(2/3) Installing libcurl (7.58.0-r0)
(3/3) Installing curl (7.58.0-r0)
Executing busybox-1.27.2-r7.trigger
Executing ca-certificates-20171114-r0.trigger
OK: 5 MiB in 14 packages
/ # curl <node ip>:24224
< hangs >
Uh Oh – what happened? I should definitely be able to access the fluentd instance that I know is running on the node at that address. Having dealt with a similar connectivity issue in the past few days, I’ve got a quick hunch it might be due misconfigured ufw on the server. It’s entirely possible that traffic from teh pod network is not being allowed to hit the host machine through the machine’s IP. To test, all I need to do is add a rule that allows traffic from the pod CIDR to the host machine…
user@server $ sudo ufw allow from 10.244.0.0/16 to XXX.XXX.XXX.XXX port 24224
Without even leaving the alpine container I started, I can jump back in and test. After going in, I decided to get a little bit more fancy with my testing, using the python fluent-logger library to test:
/ # apk add py2-pip
(1/3) Installing python2 (2.7.14-r2)
(2/3) Installing py-setuptools (33.1.1-r1)
(3/3) Installing py2-pip (9.0.1-r1)
Executing busybox-1.27.2-r7.trigger
OK: 187 MiB in 55 packages
/ # python
Python 2.7.14 (default, Dec 14 2017, 15:51:29)
[GCC 6.4.0] on linux2
Type "help", "copyright", "credits" or "license" for more information.
>>>
/ # pip install fluent-logger
Collecting fluent-logger
  Downloading fluent_logger-0.9.2-py2.py3-none-any.whl
Collecting msgpack (from fluent-logger)
  Downloading msgpack-0.5.6.tar.gz (138kB)
    100% |████████████████████████████████| 143kB 3.5MB/s
Installing collected packages: msgpack, fluent-logger
  Running setup.py install for msgpack ... done
Successfully installed fluent-logger-0.9.2 msgpack-0.5.6
/ # python
Python 2.7.14 (default, Dec 14 2017, 15:51:29)
[GCC 6.4.0] on linux2
Type "help", "copyright", "credits" or "license" for more information.
>>> from fluent import sender
>>> logger = sender.FluentSender('test')
>>> logger = sender.FluentSender('test', host='XXX.XXX.XXX.XXX', port=24224)
>>> result = logger.emit('test', {'working': 'true'})
>>> result
False
>>> logger.last_error
error(111, 'Connection refused')
Uh-oh, it looks like instead of hanging now, the connection is being straight-up refused. So I was right to check UFW, but now we’ve got a different problem – something is wrong on the container/pod/kubernetes side. I need to ensure that the daemon set is listening as it should be – nodePort should have ben all I needed to ensure that the container grabbed port on the host.
One way to ensure that the pod is listening on the node itself is to SSH in and run lsof -i:
user@server $ sudo lsof -i | grep 24224
user@server $
Clearly, the fluentd DaemonSet is definitely NOT listening on the node at all, at any address. After a bit of digging, I stumbled upon A github issue about hostPort not working which lead me to CNI discussion in another github issue – CNI actually doesn’t support hostPort! It was more of a docker thing, and although the first github issue suggested that using hostNetwork: true would work, I want to see if I can find a better solution that doesn’t expose every single port from the container on the host.
It looks like I’ll actually need a special CNI plugin to do this properly, called portmap. The example for calico looks like this (found in the second github issue):
{
  "type": "portmap",
  "capabilities": {"portMappings": true},
  "snat": true
}
Turns out that kube-router actually has an issue for this, and user @jpiper is absolutely correct – since CNI comes with the portmap plugin (which you can see in the resolved CNI issue), all it takes is a little configuration. On the way I also bettered my configuration by switching to a .conflist instead of multiple .confs. Here’s what /etc/cni/net.d/10-kuberouter.conflist looks like:
{
  "cniVersion": "0.3.0",
  "name": "net",
  "plugins": [
    {
      "isDefaultGateway": true,
      "name": "kubernetes",
      "type": "bridge",
      "bridge": "kube-bridge",
      "ipam": {
        "type": "host-local",
        "subnet": "10.244.1.0/24"
      }
    },
    {
      "type": "portmap",
      "capabilities": {
        "snat":true,
        "portMappings":true
      }
   }
  ]
}
After changing this file, I ran a systemctl restart containerd cri-containerd to get the changes picked up by cri-containerd. A journalctl -xe -u cri-containerd also doesn’t hurt, to ensure that the config was properly picked up.
Time to hop into the testing container and try it again:
$ k run --rm -it --image=alpine test-fluentd
If you don't see a command prompt, try pressing enter.

/ #
/ # apk --update add py2-pip
fetch http://dl-cdn.alpinelinux.org/alpine/v3.7/main/x86_64/APKINDEX.tar.gz
fetch http://dl-cdn.alpinelinux.org/alpine/v3.7/community/x86_64/APKINDEX.tar.gz
(1/12) Installing libbz2 (1.0.6-r6)
(2/12) Installing expat (2.2.5-r0)
(3/12) Installing libffi (3.2.1-r4)
(4/12) Installing gdbm (1.13-r1)
(5/12) Installing ncurses-terminfo-base (6.0_p20171125-r0)
(6/12) Installing ncurses-terminfo (6.0_p20171125-r0)
(7/12) Installing ncurses-libs (6.0_p20171125-r0)
(8/12) Installing readline (7.0.003-r0)
(9/12) Installing sqlite-libs (3.21.0-r0)
(10/12) Installing python2 (2.7.14-r2)
(11/12) Installing py-setuptools (33.1.1-r1)
(12/12) Installing py2-pip (9.0.1-r1)
Executing busybox-1.27.2-r7.trigger
OK: 62 MiB in 23 packages
/ # pip install fluent-logger
Collecting fluent-logger
Downloading fluent_logger-0.9.2-py2.py3-none-any.whl
Collecting msgpack (from fluent-logger)
Downloading msgpack-0.5.6.tar.gz (138kB)
100% |████████████████████████████████| 143kB 3.4MB/s
Installing collected packages: msgpack, fluent-logger
Running setup.py install for msgpack ... done
Successfully installed fluent-logger-0.9.2 msgpack-0.5.6
/ # python
Python 2.7.14 (default, Dec 14 2017, 15:51:29)
[GCC 6.4.0] on linux2
Type "help", "copyright", "credits" or "license" for more information.
>>> from fluent import sender
>>> logger = sender.FluentSender ('test', host='XXX.XXX.XXX.XXX', port=24224)
>>> result = logger.emit ('test', {'working': 'true'})
>>> result
True
Awesome! I Learned a little bit about CNI, and super glad that it’s come this far and this wasn’t too big of a stumbling block! Up until now, the result variable was coming up False, but True means that logger was able to contact FluentD and leave the message.
At this point, fluentd is successful set up – though it’s not quite configured to actually send the logs anywhere. That’ll be coming up soon, but before I do that, let’s get Elastic Search up and running.
The process for getting ES up and runnig is actually going to be pretty similar, but differ in one way – This time I’m going to set up a StatefulSet, NOT a DaemonSet, and use a PersistentVolumeClaim to obtain local disk space, since we want data that makes it to ElasticSearch to stick around.
NOTE There is actually a better way to spin up services like ES inside Kubernetes, using the Operator pattern pioneered by CoreOS. I’m eschewing that pattern for now, just to keep this guide as basic as possible, and close to Kubernetes “metal” as possible.
Since I already have a monitoring namespace, all I need should be a StatefulSet, ServiceAccount (for it to run as), and a Service to make it easily reachable across the cluster (in particular, by the fluentd pod running in the DaemonSet we set up earlier).
I’ll skip the ServiceAccount since it’s pretty basic, and I don’t need to actually set anything special up, here’s the headless Service:
---
apiVersion: v1
kind: Service
metadata:
  name: elasticsearch
  namespace: monitoring
  labels:
    name: elastic-search
    tier: logging
spec:
  clusterIP: None
  selector:
    app: elastic-search
    tier: logging
  ports:
  - protocol: TCP
    port: 9200 # this is the default http administration interface port for ES
    targetPort: 9200
    name: elasticsearch
And here’s the StatefulSet:
---
apiVersion: apps/v1
kind: StatefulSet
metadata:
  name: elastic-search
  namespace: monitoring
  labels:
    name: elastic-search
    app: elastic-search
    tier: logging
    resource: logging
spec:
  replicas: 1
  serviceName: elasticsearch
  selector:
    matchLabels:
      app: elastic-search
      tier: logging
  template:
    metadata:
      labels:
        app: elastic-search
        tier: logging
    spec:
      serviceAccount: elastic-search
      terminationGracePeriodSeconds: 120
      containers:
      - name: es
        image: docker.elastic.co/elasticsearch/elasticsearch-platinum:6.2.2
        resources:
          limits:
            cpu: "2"
            memory: "4Gi"
        ports:
        - containerPort: 9200
        - containerPort: 9300
        env:
        - name: ELASTIC_PASSWORD
          value: thisisabadpassword
        - name: "discovery.type"
          value: single-node
        volumeMounts:
        - mountPath: /usr/share/elasticsearch/data
          name: esdata
      volumes:
      - name: esdata
        persistentVolumeClaim:
          claimName: elastic-search-pvc
Also here’s the PVC:
---
apiVersion: v1
kind: PersistentVolumeClaim
metadata:
  name: elastic-search-pvc
  namespace: monitoring
  labels:
    app: elastic-search
spec:
  storageClassName: rook-block
  accessModes:
  - ReadWriteOnce
  resources:
    requests:
      storage: 10Gi
Important to check that the PVC was bound:
$ k get pvc -n monitoring
NAME                 STATUS    VOLUME                                     CAPACITY   ACCESS MODES   STORAGECLASS   AGE
elastic-search-pvc   Bound     pvc-05badeda-18bc-11e8-a591-8c89a517d15e   10Gi       RWO            rook-block     52s
It really is pretty awesome to be able to use local on-node storage so dynamically – a post on what I did to set up Rook is all written up, and will be published as soon as I can get to it! Go check out Rook’s quickstart documentation in the meantime if you’re interested.
After trying to create the resource above with kubectl, I ran into some issues with the pod pulling down the docker container from elastic… This lead to realizing that there is much more involved than just the minimal StatefulSet I wrote earlier, Take a look at the awesome work done and documented by @pires. Based on his set up, I updated my resource definition for the StatefulSet, kubectl apply -f’d, deleted the pod that was there, and let everything restart. Here’s the full working configuration at the time:
---
apiVersion: apps/v1
kind: StatefulSet
metadata:
  name: elastic-search
  namespace: monitoring
  labels:
    name: elastic-search
    app: elastic-search
    tier: logging
    resource: logging
spec:
  replicas: 1
  serviceName: elasticsearch
  selector:
    matchLabels:
      app: elastic-search
      tier: logging
  template:
    metadata:
      labels:
        app: elastic-search
        tier: logging
    spec:
      # Service Account
      serviceAccount: elastic-search
      terminationGracePeriodSeconds: 120
      # Containers
      containers:
      - name: es
        image: quay.io/pires/docker-elasticsearch-kubernetes:6.1.2
        resources:
          limits:
            cpu: "2"
            memory: "4Gi"
        ports:
        - containerPort: 9300
          name: transport
        - containerPort: 9200
          name: http
        env:
        - name: NAMESPACE
          valueFrom:
            fieldRef:
              fieldPath: metadata.namespace
        - name: NODE_NAME
          valueFrom:
            fieldRef:
              fieldPath: metadata.name
        - name: CLUSTER_NAME
          value: monitoring
        - name: NODE_DATA
          value: "false"
        - name: ES_JAVA_OPTS
          value: -Xms512m -Xmx512m
        - name: ELASTIC_PASSWORD
          value: thisisabadpassword
        - name: "discovery.type"
          value: single-node
        livenessProbe:
          tcpSocket:
            port: transport
        volumeMounts:
        - mountPath: /data
          name: esdata
      # Volumes
      volumes:
      - name: esdata
        persistentVolumeClaim:
          claimName: elastic-search-pvc
I removed the privileged init container that was being used in @pires’s configuration and actually made the max_map_count change on the node itself in this configuration. A bit of a note from the future though, it doesn’t last (I put the init container back).
And here’s the check:
$ k get pods -n monitoring
NAME               READY     STATUS    RESTARTS   AGE
elastic-search-0   1/1       Running   0          37s
fluentd-khmtj      1/1       Running   2          2h
Here’s the initial batch of logs from elastic search:
$ k logs elastic-search-0 -n monitoring
[2018-02-23T17:32:55,742] [INFO] [o.e.n.Node] [elastic-search-0] initializing ...
[2018-02-23T17:32:55,925] [INFO] [o.e.e.NodeEnvironment] [elastic-search-0] using [1] data paths, mounts [[/data (/dev/rbd1)]], net usable_space [9.2gb], net total_space [9.7gb], types [ext4]
[2018-02-23T17:32:55,926] [INFO] [o.e.e.NodeEnvironment] [elastic-search-0] heap size [494.9mb], compressed ordinary object pointers [true]
[2018-02-23T17:32:55,927] [INFO] [o.e.n.Node] [elastic-search-0] node name [elastic-search-0], node ID [yM2SIQlqQh6eU0nx9uYd-g]
[2018-02-23T17:32:55,927] [INFO] [o.e.n.Node] [elastic-search-0] version [6.1.2], pid [1], build [5b1fea5/2018-01-10T02:35:59.208Z], OS [Linux/4.15.3-1-ARCH/amd64], JVM [Oracle Corporation/OpenJDK 64-Bit Server VM/1.8.0_151/25.151-b12]
[2018-02-23T17:32:55,927] [INFO] [o.e.n.Node] [elastic-search-0] JVM arguments [-XX:+UseConcMarkSweepGC, -XX:CMSInitiatingOccupancyFraction=75, -XX:+UseCMSInitiatingOccupancyOnly, -XX:+DisableExplicitGC, -XX:+AlwaysPreTouch, -Xss1m, -Djava.awt.headless=true, -Dfile.encoding=UTF-8, -Djna.nosys=true, -Djdk.io.permissionsUseCanonicalPath=true, -Dio.netty.noUnsafe=true, -Dio.netty.noKeySetOptimization=true, -Dlog4j.shutdownHookEnabled=false, -Dlog4j2.disable.jmx=true, -Dlog4j.skipJansi=true, -XX:+HeapDumpOnOutOfMemoryError, -Xms512m, -Xmx512m, -Des.path.home=/elasticsearch, -Des.path.conf=/elasticsearch/config]
[2018-02-23T17:32:57,491] [INFO] [o.e.p.PluginsService] [elastic-search-0] loaded module [aggs-matrix-stats]
[2018-02-23T17:32:57,492] [INFO] [o.e.p.PluginsService] [elastic-search-0] loaded module [analysis-common]
[2018-02-23T17:32:57,492] [INFO] [o.e.p.PluginsService] [elastic-search-0] loaded module [ingest-common]
[2018-02-23T17:32:57,492] [INFO] [o.e.p.PluginsService] [elastic-search-0] loaded module [lang-expression]
[2018-02-23T17:32:57,492] [INFO] [o.e.p.PluginsService] [elastic-search-0] loaded module [lang-mustache]
[2018-02-23T17:32:57,492] [INFO] [o.e.p.PluginsService] [elastic-search-0] loaded module [lang-painless]
[2018-02-23T17:32:57,492] [INFO] [o.e.p.PluginsService] [elastic-search-0] loaded module [mapper-extras]
[2018-02-23T17:32:57,492] [INFO] [o.e.p.PluginsService] [elastic-search-0] loaded module [parent-join]
[2018-02-23T17:32:57,492] [INFO] [o.e.p.PluginsService] [elastic-search-0] loaded module [percolator]
[2018-02-23T17:32:57,492] [INFO] [o.e.p.PluginsService] [elastic-search-0] loaded module [reindex]
[2018-02-23T17:32:57,492] [INFO] [o.e.p.PluginsService] [elastic-search-0] loaded module [repository-url]
[2018-02-23T17:32:57,492] [INFO] [o.e.p.PluginsService] [elastic-search-0] loaded module [transport-netty4]
[2018-02-23T17:32:57,492] [INFO] [o.e.p.PluginsService] [elastic-search-0] loaded module [tribe]
[2018-02-23T17:32:57,493] [INFO] [o.e.p.PluginsService] [elastic-search-0] no plugins loaded
[2018-02-23T17:33:00,184] [INFO] [o.e.d.DiscoveryModule] [elastic-search-0] using discovery type [zen]
[2018-02-23T17:33:00,841] [INFO] [o.e.n.Node] [elastic-search-0] initialized
[2018-02-23T17:33:00,841] [INFO] [o.e.n.Node] [elastic-search-0] starting ...
[2018-02-23T17:33:00,953] [INFO] [o.e.t.TransportService] [elastic-search-0] publish_address {10.244.1.31:9300}, bound_addresses {10.244.1.31:9300}
[2018-02-23T17:33:00,961] [INFO] [o.e.b.BootstrapChecks] [elastic-search-0] bound or publishing to a non-loopback address, enforcing bootstrap checks
[2018-02-23T17:33:00,980] [WARN] [o.e.d.z.UnicastZenPing] [elastic-search-0] failed to resolve host [elasticsearch-discovery]
java.net.UnknownHostException: elasticsearch-discovery: Name does not resolve
at java.net.Inet6AddressImpl.lookupAllHostAddr (Native Method) ~ [?:1.8.0_151]
at java.net.InetAddress$2.lookupAllHostAddr (InetAddress.java:928) ~ [?:1.8.0_151]
at java.net.InetAddress.getAddressesFromNameService (InetAddress.java:1323) ~ [?:1.8.0_151]
at java.net.InetAddress.getAllByName0 (InetAddress.java:1276) ~ [?:1.8.0_151]
at java.net.InetAddress.getAllByName (InetAddress.java:1192) ~ [?:1.8.0_151]
at java.net.InetAddress.getAllByName (InetAddress.java:1126) ~ [?:1.8.0_151]
at org.elasticsearch.transport.TcpTransport.parse (TcpTransport.java:917) ~ [elasticsearch-6.1.2.jar:6.1.2]
at org.elasticsearch.transport.TcpTransport.addressesFromString (TcpTransport.java:872) ~ [elasticsearch-6.1.2.jar:6.1.2]
at org.elasticsearch.transport.TransportService.addressesFromString (TransportService.java:699) ~ [elasticsearch-6.1.2.jar:6.1.2]
at org.elasticsearch.discovery.zen.UnicastZenPing.lambda$null$0 (UnicastZenPing.java:213) ~ [elasticsearch-6.1.2.jar:6.1.2]
at java.util.concurrent.FutureTask.run (FutureTask.java:266) ~ [?:1.8.0_151]
at org.elasticsearch.common.util.concurrent.ThreadContext$ContextPreservingRunnable.run (ThreadContext.java:568) [elasticsearch-6.1.2.jar:6.1.2]
at java.util.concurrent.ThreadPoolExecutor.runWorker (ThreadPoolExecutor.java:1149) [?:1.8.0_151]
at java.util.concurrent.ThreadPoolExecutor$Worker.run (ThreadPoolExecutor.java:624) [?:1.8.0_151]
at java.lang.Thread.run (Thread.java:748) [?:1.8.0_151]
[2018-02-23T17:33:04,004] [INFO] [o.e.c.s.MasterService] [elastic-search-0] zen-disco-elected-as-master ([0] nodes joined), reason: new_master {elastic-search-0}{yM2SIQlqQh6eU0nx9uYd-g}{WwiHVWQqRTWtJPwD5MM3DA}{10.244.1.31}{10.244.1.31:9300}
[2018-02-23T17:33:04,010] [INFO] [o.e.c.s.ClusterApplierService] [elastic-search-0] new_master {elastic-search-0}{yM2SIQlqQh6eU0nx9uYd-g}{WwiHVWQqRTWtJPwD5MM3DA}{10.244.1.31}{10.244.1.31:9300}, reason: apply cluster state (from master [master {elastic-search-0}{yM2SIQlqQh6eU0nx9uYd-g}{WwiHVWQqRTWtJPwD5MM3DA}{10.244.1.31}{10.244.1.31:9300} committed version [1] source [zen-disco-elected-as-master ([0] nodes joined)]])
[2018-02-23T17:33:04,064] [INFO] [o.e.n.Node] [elastic-search-0] started
[2018-02-23T17:33:04,153] [INFO] [o.e.g.GatewayService] [elastic-search-0] recovered [0] indices into cluster_state
A bit noisy but the logs look generally good, minus that UnknownHostException (Note from the future ignoring this warning/error is going to cause me a ton of trouble). My PVC mount is being used, total space is right, all the options look like what I want, and one warning about not being able to find the elasticsearch-discovery address, which is likely fine since it’s a single node cluster.
Before I move on, I’ll do a quick check to ensure that the cluster is reachable from a random node:
$ k run --rm -it --image=alpine test-es
If you don't see a command prompt, try pressing enter.
/ # curl http://elasticsearch.monitoring:9200/_cat/health
1519407653 17:40:53 monitoring green 1 0 0 0 0 0 0 0 - 100.0%
Awesome, so now we know we can get to elastic search’s HTTP endpoint (which @pires had disabled but I re-enabled) from the default namespace, from a random alpine cluster!
Time to double back and get fluentd to dump it’s logs to ES.
Up until now, I’ve not specified any custom configuration for fluentd, but nows the time to start, and the Elastic Search Output Plugin is the thing to start with. The configuration is pretty straight forward, but one thing I wonder is if I’ll need to basically re-write the default configuration in addition to adding my own changes.
After pulling out the default configuration the container was using and adding the elasticsearch plugin, the ConfigMap looks like this:
apiVersion: v1
kind: ConfigMap
metadata:
  name: fluentd-es-config
  namespace: monitoring
data:
  fluent.conf: |-
    <source>
      @type forward
      @id input1
      @label @mainstream
      port 24224
    </source>

    <filter **>
      @type stdout
    </filter>

    <label @mainstream>

      <match app.**>
         @type elasticsearch
         host elasticsearch.monitoring
         port 9200
         index_name fluentd
         type_name fluentd
       </match>

      <match **>
         @type file
         @id output1
         path /fluentd/log/data.*.log
         symlink_path /fluentd/log/data.log
         append true
         time_slice_format %Y%m%d
         time_slice_wait 10m
         time_format %Y%m%dT%H%M%S%z
         buffer_path /fluentd/log/data.*.log
       </match>

    </label>
And the updates to the StatefulSet are pretty minimal:
# ... other stuff ....
        volumeMounts:
          - name: fluentd-logs
            mountPath: /fluentd/log
          - name: config # <----- here
            mountPath: /fluentd/etc
      volumes:
      - name: fluentd-logs
        emptyDir: {}
      - name: config # <----- and here
        configMap:
          name: fluentd-es-config
# ... other stuff ....
When I tried to start fluentd again it actually went into a crash loop – due to the fact that the elasticsearch plugin actually wasn’t installed in the container I was using. Due to that, I switched to using the k8s.gcr.io/fluentd-elasticsearch:v2.0.4 image. After that it was all smooth sailing:
$ k logs fluentd-lr9s8 -n monitoring
2018-02-23 18:22:21 +0000 [info]: parsing config file is succeeded path= "/etc/fluent/fluent.conf"
2018-02-23 18:22:21 +0000 [info]: using configuration file: <ROOT>
<match fluent.**>
@type null
</match>
</ROOT>
2018-02-23 18:22:21 +0000 [info]: starting fluentd-1.1.0 pid=9 ruby= "2.3.3"
2018-02-23 18:22:21 +0000 [info]: spawn command to main:  cmdline= ["/usr/bin/ruby2.3", "-Eascii-8bit:ascii-8bit", "/usr/local/bin/fluentd", "--under-supervisor"]
2018-02-23 18:22:22 +0000 [info]: gem 'fluent-plugin-detect-exceptions' version '0.0.9'
2018-02-23 18:22:22 +0000 [info]: gem 'fluent-plugin-elasticsearch' version '2.4.1'
2018-02-23 18:22:22 +0000 [info]: gem 'fluent-plugin-kubernetes_metadata_filter' version '1.0.1'
2018-02-23 18:22:22 +0000 [info]: gem 'fluent-plugin-multi-format-parser' version '1.0.0'
2018-02-23 18:22:22 +0000 [info]: gem 'fluent-plugin-prometheus' version '0.3.0'
2018-02-23 18:22:22 +0000 [info]: gem 'fluent-plugin-systemd' version '0.3.1'
2018-02-23 18:22:22 +0000 [info]: gem 'fluentd' version '1.1.0'
2018-02-23 18:22:22 +0000 [info]: adding match pattern= "fluent.**" type= "null"
2018-02-23 18:22:22 +0000 [info]: #0 starting fluentd worker pid=13 ppid=9 worker=0
2018-02-23 18:22:22 +0000 [info]: #0 fluentd worker is now running worker=0
I’m not using any of the other plugins afforded by the image, but maybe I will in the future – for now what I’m most worried about is the fact that I don’t see a adding match pattern= type message for the matches I added (specifically app.**). I need to take one more look at how this container handles feeding configuration to fluentd itself.
I copied the ENV value for FLUENTD_ARGS and also moved my config volume to /etc/fluent/config.d, to produce this updated DaemonSet configuration for fluentd:
---
apiVersion: apps/v1
kind: DaemonSet
metadata:
  name: fluentd
  namespace: monitoring
  labels:
    name: default-fluentd
    app: fluentd
    resource: logs
spec:
  # Service
  selector:
    matchLabels:
      app: fluentd
      tier: logging
  # Pod
  template:
    metadata:
      labels:
        app: fluentd
        tier: logging
        resource: logs
      annotations:
        scheduler.alpha.kubernetes.io/critical-pod: '' # logging's pretty important
    spec:
      serviceAccountName: fluentd
      terminationGracePeriodSeconds: 120
      containers:
      - name: fluentd
        image: k8s.gcr.io/fluentd-elasticsearch:v2.0.4
        resources:
          limits:
            cpu: "1"
            memory: "500Mi"
        env:
          - name: FLUENTD_ARGS
            value: --no-supervisor -q
          - name: FLUENTD_CONF
            value: "fluent.conf"
        ports:
        - containerPort: 24224
          hostPort: 24224
          protocol: UDP
        - containerPort: 24224
          hostPort: 24224
          protocol: TCP
        volumeMounts:
          - name: fluentd-logs
            mountPath: /fluentd/log
          - name: config
            mountPath: /etc/fluent/config.d
      volumes:
      - name: fluentd-logs
        emptyDir: {}
      - name: config
        configMap:
          name: fluentd-es-config
After creating that resource, fluentd looks to be working properly, the only warning I see is about time_format:
$ k logs -f fluentd-x9jtf -n monitoring
2018-02-23 18:30:08 +0000 [warn]: [output1] 'time_format' specified without 'time_key', will be ignored
As I’m sending all the logs that come to elastic search, I’m not sure exactly how I’m going to structure the messages yet for every app, and what JSON key the time will be under. I’m not too worried about it though. I’m going to play it fast, loose, and dangerous here – I’m going to assume that this is working properly without verifying, and move on to setting up Kibana.
Now that FluentD is talking to elastic search, all that’s left is to set up Kibana to talk to Elastic Search and configure it to display the log messages we’re after. I won’t concern myself with the myriad of features that ES + Kibana can offer me for now, and will just go with a simple viewing of the logs. Here’s what the resource configuration looks like for a simple Kibana Deployment:
---
apiVersion: apps/v1
kind: Deployment
metadata:
  name: kibana
  namespace: monitoring
  labels:
    k8s-app: kibana
    kubernetes.io/cluster-service: "true"
    addonmanager.kubernetes.io/mode: Reconcile
spec:
  replicas: 1
  selector:
    matchLabels:
      app: kibana
  template:
    metadata:
      labels:
        app: kibana
    spec:
      containers:
      - name: kibana
        image: docker.elastic.co/kibana/kibana:5.6.4
        resources:
          # need more cpu upon initialization, therefore burstable class
          limits:
            cpu: 1000m
          requests:
            cpu: 100m
        env:
          - name: ELASTICSEARCH_URL
            value: http://elasticsearch:9200
          - name: SERVER_BASEPATH
            value: /api/v1/namespaces/kube-system/services/kibana/proxy
          - name: XPACK_MONITORING_ENABLED
            value: "false"
          - name: XPACK_SECURITY_ENABLED # hmnnn
            value: "false"
        ports:
        - containerPort: 5601
          name: ui
          protocol: TCP
I have an issue pulling all of the images from docker.elastic.co/, so I’m just sidestepping them. In this instance I’m using blacktop/kibana.
And here’s the Service to go with it, mostly copied from the addon (like the Deployment is as well)
---
apiVersion: v1
kind: Service
metadata:
  name: kibana
  namespace: monitoring
  labels:
    app: kibana
    kubernetes.io/cluster-service: "true"
    addonmanager.kubernetes.io/mode: Reconcile
    kubernetes.io/name: "Kibana"
spec:
  ports:
  - port: 5601
    protocol: TCP
    targetPort: ui
  selector:
    app: kibana
To test that kibana is up at all, I can port-forward:
$ k port-forward kibana-6c4d989557-ht84c 5601:5601 -n monitoring
Forwarding from 127.0.0.1:5601 -> 5601
And if I look in my browser:
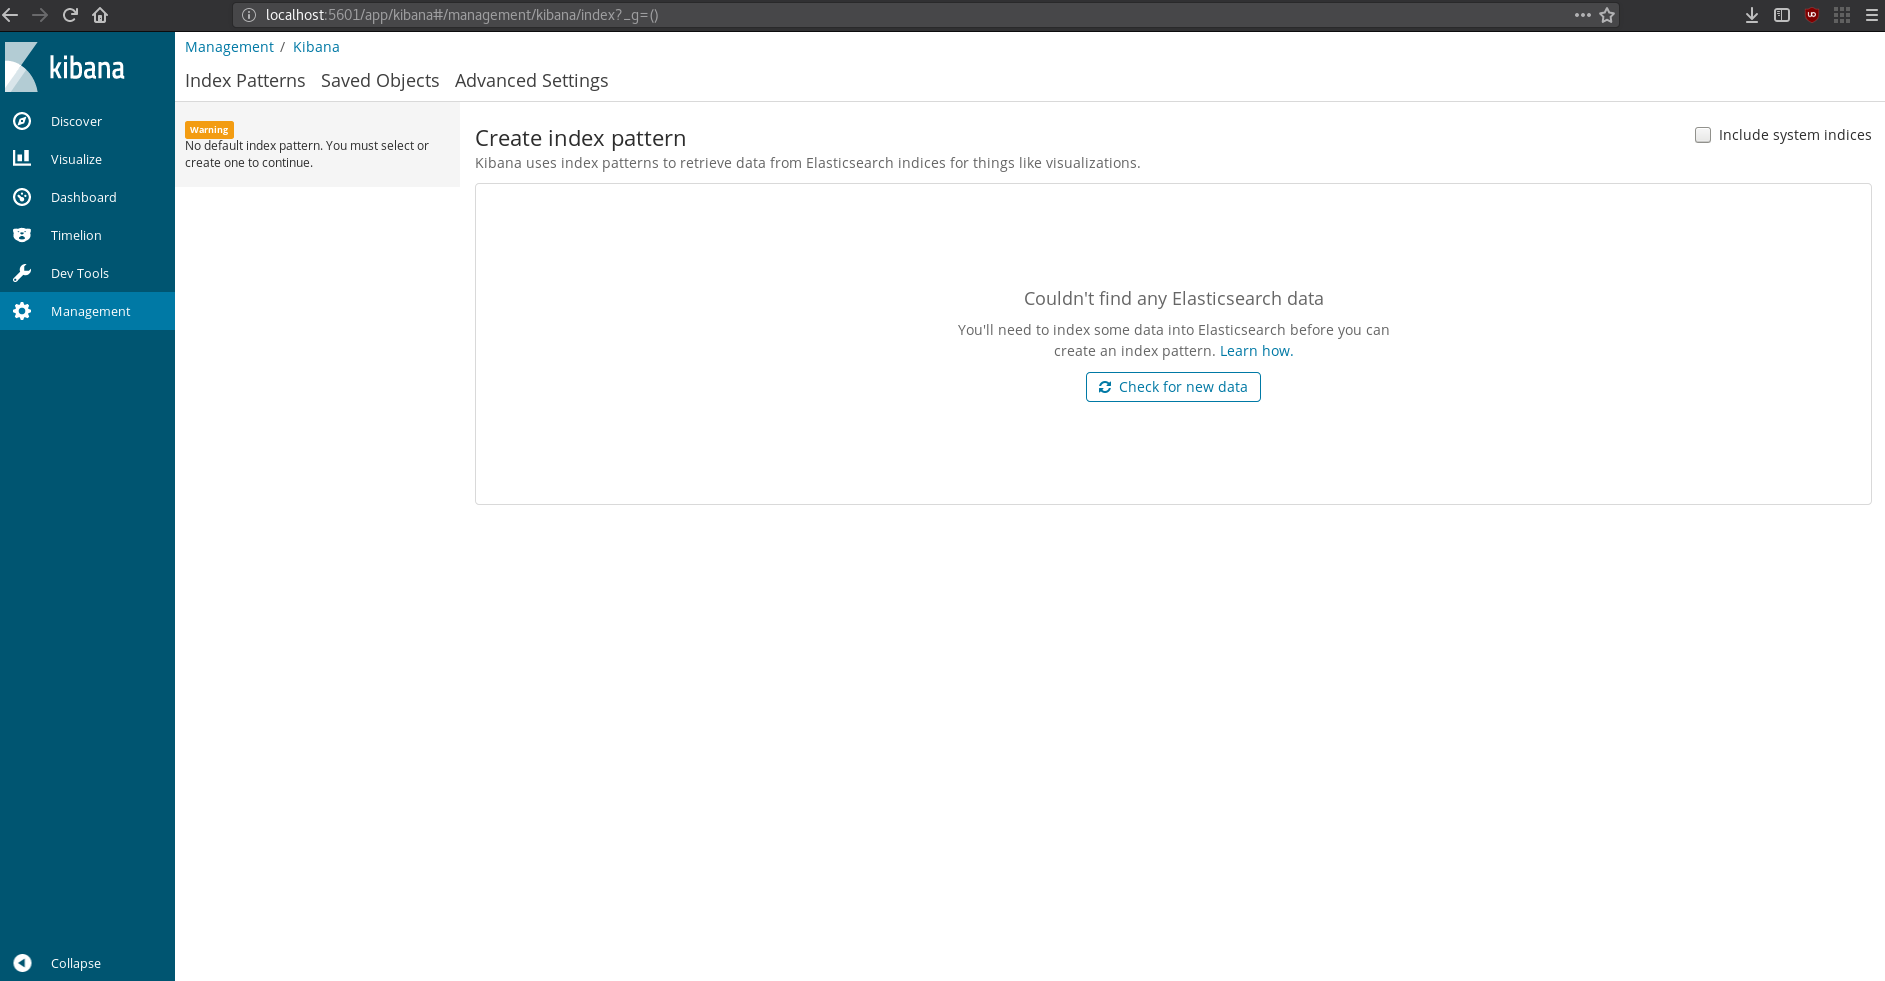
Kibana’s up! It says there’s no data in elastic search (and it also had an error about the max shards being >= 1 or something), so at least it’s running and able to connect. Time to test it all out, pretty exciting.
To test the whole setup end to end, the plan is simple:
alpine podfluent-logger for pythonfluent-logger to write some logs and watch them show up in Kibana.Here’s what using the alpine pod looked like:
/ # pip install fluent-logger
Collecting fluent-logger
Downloading fluent_logger-0.9.2-py2.py3-none-any.whl
Collecting msgpack (from fluent-logger)
Downloading msgpack-0.5.6.tar.gz (138kB)
100% |████████████████████████████████| 143kB 2.8MB/s
Installing collected packages: msgpack, fluent-logger
Running setup.py install for msgpack ... done
Successfully installed fluent-logger-0.9.2 msgpack-0.5.6
/ # python
Python 2.7.14 (default, Dec 14 2017, 15:51:29)
[GCC 6.4.0] on linux2
Type "help", "copyright", "credits" or "license" for more information.
>>> from fluent import sender
>>> logger = sender.FluentSender ('app', host='<Node IP>, port=24224)
>>> logger.emit ('test-log', {'from': 'local', 'to': 'local', 'msg': 'Hello World!'})
True
>>>
Unfortunately, while fluent-logger reported a success this time (yay!), there are still errors in the Kibana UI:
So it looks like Kibana can’t access ElasticSearch, let’s fix it! To debug I opened up a shell in the container, but found that I could access elastic search just fine from inside the kibana pod:
$ k exec -it kibana-6c4d989557-ht84c -n monitoring sh
/usr/share/kibana # wget elasticsearch:9200
Connecting to elasticsearch:9200 (10.244.1.34:9200)
index.html           100% |***************************************************************************************|   438   0:00:00 ETA
Welp, that’s weird, maybe some of the other options I put in the pod are confusing Kibana? I found a github issue that kind of seems related, but what it’s pointing me at is that the version of kibana you run with elastic search is actually pretty important. Let me go back and make sure they match up!
Looks like Kibana tried to warn me:
$ k logs kibana-76df8d6b9c-ggzzv -n monitoring
{"type":"log","@timestamp":"2018-02-23T19:01:04Z","tags":["status","plugin:kibana@6.1.3","info"],"pid":1,"state":"green","message":"Status changed from uninitialized to green - Ready","prevState":"uninitialized","prevMsg":"uninitialized"}
{"type":"log","@timestamp":"2018-02-23T19:01:04Z","tags":["status","plugin:elasticsearch@6.1.3","info"],"pid":1,"state":"yellow","message":"Status changed from uninitialized to yellow - Waiting for Elasticsearch","prevState":"uninitialized","prevMsg":"uninitialized"}
{"type":"log","@timestamp":"2018-02-23T19:01:04Z","tags":["status","plugin:console@6.1.3","info"],"pid":1,"state":"green","message":"Status changed from uninitialized to green - Ready","prevState":"uninitialized","prevMsg":"uninitialized"}
{"type":"log","@timestamp":"2018-02-23T19:01:04Z","tags":["warning"],"pid":1,"kibanaVersion":"6.1.3","nodes":[{"version":"6.1.2","http":{"publish_address":"10.244.1.34:9200"},"ip":"10.244.1.34"}],"message":"You're running Kibana 6.1.3 with some different versions of Elasticsearch. Update Kibana or Elasticsearch to the same version to prevent compatibility issues: v6.1.2 @ 10.244.1.34:9200 (10.244.1.34)"}
So to try and fix this I downgraded Kibana 6.1.3 to 6.1.2, and re-deployed the Deployment, only to find out that blacktop/kibana:6.1.2 didn’t exist… Time to switch images again, this time to bitnami/kibana:6.1.2-r0…
After a bit of fiddling, I also ended up needing to add configuration for Kibana:
---
apiVersion: v1
kind: ConfigMap
metadata:
  name: kibana-config
  namespace: monitoring
data:
  kibana.yaml: |
    ---
    # Kibana is served by a back end server. This setting specifies the port to use.
    server.port: 5601

    # Specifies the address to which the Kibana server will bind. IP addresses and host names are both valid values.
    # The default is 'localhost', which usually means remote machines will not be able to connect.
    # To allow connections from remote users, set this parameter to a non-loopback address.
    server.host: 0.0.0.0

    # Enables you to specify a path to mount Kibana at if you are running behind a proxy. This only affects
    # the URLs generated by Kibana, your proxy is expected to remove the basePath value before forwarding requests
    # to Kibana. This setting cannot end in a slash.
    #server.basePath: ""

    # The maximum payload size in bytes for incoming server requests.
    #server.maxPayloadBytes: 1048576

    # The Kibana server's name.  This is used for display purposes.
    #server.name: "your-hostname"

    # The URL of the Elasticsearch instance to use for all your queries.
    elasticsearch.url: http://elasticsearch:9200

    # When this setting's value is true Kibana uses the hostname specified in the server.host
    # setting. When the value of this setting is false, Kibana uses the hostname of the host
    # that connects to this Kibana instance.
    #elasticsearch.preserveHost: true

    # Kibana uses an index in Elasticsearch to store saved searches, visualizations and
    # dashboards. Kibana creates a new index if the index doesn't already exist.
    #kibana.index: ".kibana"

    # The default application to load.
    #kibana.defaultAppId: "discover"

    # If your Elasticsearch is protected with basic authentication, these settings provide
    # the username and password that the Kibana server uses to perform maintenance on the Kibana
    # index at startup. Your Kibana users still need to authenticate with Elasticsearch, which
    # is proxied through the Kibana server.
    elasticsearch.username: "elastic"
    elasticsearch.password: "thisisabadpassword"

    # Enables SSL and paths to the PEM-format SSL certificate and SSL key files, respectively.
    # These settings enable SSL for outgoing requests from the Kibana server to the browser.
    #server.ssl.enabled: false
    #server.ssl.certificate: /path/to/your/server.crt
    #server.ssl.key: /path/to/your/server.key

    # Optional settings that provide the paths to the PEM-format SSL certificate and key files.
    # These files validate that your Elasticsearch backend uses the same key files.
    #elasticsearch.ssl.certificate: /path/to/your/client.crt
    #elasticsearch.ssl.key: /path/to/your/client.key

    # Optional setting that enables you to specify a path to the PEM file for the certificate
    # authority for your Elasticsearch instance.
    #elasticsearch.ssl.certificateAuthorities: [ "/path/to/your/CA.pem" ]

    # To disregard the validity of SSL certificates, change this setting's value to 'none'.
    #elasticsearch.ssl.verificationMode: full

    # Time in milliseconds to wait for Elasticsearch to respond to pings. Defaults to the value of
    # the elasticsearch.requestTimeout setting.
    #elasticsearch.pingTimeout: 1500

    # Time in milliseconds to wait for responses from the back end or Elasticsearch. This value
    # must be a positive integer.
    #elasticsearch.requestTimeout: 30000

    # List of Kibana client-side headers to send to Elasticsearch. To send *no* client-side
    # headers, set this value to [] (an empty list).
    #elasticsearch.requestHeadersWhitelist: [ authorization ]

    # Header names and values that are sent to Elasticsearch. Any custom headers cannot be overwritten
    # by client-side headers, regardless of the elasticsearch.requestHeadersWhitelist configuration.
    #elasticsearch.customHeaders: {}

    # Time in milliseconds for Elasticsearch to wait for responses from shards. Set to 0 to disable.
    #elasticsearch.shardTimeout: 0
    elasticsearch.maxConcurrentShardRequests: 5

    # Time in milliseconds to wait for Elasticsearch at Kibana startup before retrying.
    #elasticsearch.startupTimeout: 5000

    # Specifies the path where Kibana creates the process ID file.
    pid.file: /opt/bitnami/kibana/tmp/kibana.pid

    # Enables you specify a file where Kibana stores log output.
    #logging.dest: stdout

    # Set the value of this setting to true to suppress all logging output.
    #logging.silent: false

    # Set the value of this setting to true to suppress all logging output other than error messages.
    #logging.quiet: false

    # Set the value of this setting to true to log all events, including system usage information
    # and all requests.
    #logging.verbose: false

    # Set the interval in milliseconds to sample system and process performance
    # metrics. Minimum is 100ms. Defaults to 5000.
    #ops.interval: 5000

    # The default locale. This locale can be used in certain circumstances to substitute any missing
    # translations.
    #i18n.defaultLocale: "en"
Kinda long, all just to put in the elasticsearch.maxConcurrentShardRequests: 5 option, only to find out it doesn’t actually fix the problem. After A LOT of fiddling with versions and configuratoin, I just went to version 6.2.1 of both Kibana and ElasticSearch.
OK, so I actually spent almost 6 hours trying to debug this thing (not sure if this is is a worse sign for ElasticSearch + Kibana, or my own competence), and finally realized (the next morning) that there’s a massive error coming from ElasticSearch:
org.elasticsearch.action.NoShardAvailableActionException: No shard available for [get [.kibana][doc][config:6.1.3]: routing [null]]
        at org.elasticsearch.action.support.single.shard.TransportSingleShardAction$AsyncSingleAction.perform(TransportSingleShardAction.java:209) ~[elasticsearch-6.1.2.jar:6.1.2]
        at org.elasticsearch.action.support.single.shard.TransportSingleShardAction$AsyncSingleAction.start(TransportSingleShardAction.java:186) ~[elasticsearch-6.1.2.jar:6.1.2]
        at org.elasticsearch.action.support.single.shard.TransportSingleShardAction.doExecute(TransportSingleShardAction.java:95) ~[elasticsearch-6.1.2.jar:6.1.2]
        at org.elasticsearch.action.support.single.shard.TransportSingleShardAction.doExecute(TransportSingleShardAction.java:59) ~[elasticsearch-6.1.2.jar:6.1.2]
        at org.elasticsearch.action.support.TransportAction.doExecute(TransportAction.java:143) ~[elasticsearch-6.1.2.jar:6.1.2]
        at org.elasticsearch.action.support.TransportAction$RequestFilterChain.proceed(TransportAction.java:167) ~[elasticsearch-6.1.2.jar:6.1.2]
        at org.elasticsearch.action.support.TransportAction.execute(TransportAction.java:139) ~[elasticsearch-6.1.2.jar:6.1.2]
        at org.elasticsearch.action.support.TransportAction.execute(TransportAction.java:81) ~[elasticsearch-6.1.2.jar:6.1.2]
        at org.elasticsearch.client.node.NodeClient.executeLocally(NodeClient.java:83) ~[elasticsearch-6.1.2.jar:6.1.2]
        at org.elasticsearch.client.node.NodeClient.doExecute(NodeClient.java:72) ~[elasticsearch-6.1.2.jar:6.1.2]
        at org.elasticsearch.client.support.AbstractClient.execute(AbstractClient.java:405) ~[elasticsearch-6.1.2.jar:6.1.2]
        at org.elasticsearch.client.support.AbstractClient.get(AbstractClient.java:497) ~[elasticsearch-6.1.2.jar:6.1.2]
        at org.elasticsearch.rest.action.document.RestGetAction.lambda$prepareRequest$0(RestGetAction.java:82) ~[elasticsearch-6.1.2.jar:6.1.2]
        at org.elasticsearch.rest.BaseRestHandler.handleRequest(BaseRestHandler.java:97) [elasticsearch-6.1.2.jar:6.1.2]
        at org.elasticsearch.rest.RestController.dispatchRequest(RestController.java:240) [elasticsearch-6.1.2.jar:6.1.2]
ElasticSearch doesn’t think it has any shards, and I’m not sure why.
Welp, evidently this issue was caused by data left from one time that I ran it – Once I cleared out the data directory, Kibana was showing the UI again. However, the issue of having no shards (which might just be due to there being no data to query just yet) and the problem of [illegal_argument_exception] maxConcurrentShardRequests must be >= 1 still remain. I actually filed a ticket in the Kibana repo since I was so perplexed as to why the query param wasn’t getting sent.
At the very least, I want to get an answer to the maxConcurrentShardRequests question before I go about fixing the no-shards issue. The fact that I have no shards may very well be due to the fact that there’s no data in elastic search just yet. It took me at least 8 hours to debug to this point, and I’m feeling kinda worn out (I’ve considered just pivoting this blogpost to “how to install graylog on kubernetes” at least 6 times).
There’s a startling lack of documentation on how to view Logs in Grafana (my guess is people just don’t do it, and use Grafana for more metrics/aggregation stuff), but it can connect to elastic search, so while Kibana is broken, I’m going to check out Grafana, and see if I can see the logs I expect.
Grafana is super easy to setup and get started, but unfortunately, it can’t connect to elastic search. I’m just about fed up with ElasticSearch.
I’ve gotten so fed up with how much trouble I’ve had setting up ES + Kibana that I’ve started going into delusions of how I’d write my own scalable, easy to start search & log tool. It’s frustrating that I’m having so much trouble setting up two tools that are supposed to work together seamlessly, and the fact that it just doesn’t work on a single node and scale out gracefully. I think I’m done ever trying to use ElasticSearch again.
It might be insane, but here’s the basic idea, I think I can actually do it with SQlite:
This seems really similar to the work done by rqlite, but I think I’m going to aim to make a simpler subset (people won’t be sending operations to SQLite, they’ll ONLY be sending/forwarding structured logs, so I don’t need generalized replicated statement replication which is what rqlite does).
While I seriously considered just pivoting this blog post to be about how I started making a new competitor, I’m still pretty driven to actually get the stack up and running – so let’s give this another go. It’s been a few days since I last tried, so I think I’ve learned a bit and am ready to try again. Let’s do this.
So how is this time going to be any different?
elasticsearch-head for cerebro, but that shouldn’t change much (it’s just a sidecar container).Not very hard to do, basically just needed to apply the FluentD related configs I had:
$ k apply -f fluentd.configmap.yml -n monitoring
$ k apply -f fluentd.serviceaccount.yaml -n monitoring
$ k apply -f fluentd.ds.yaml -n monitoring
What’s in these files is @ the end of the post (TLDR section).
After creating the monitoring namespace, I got about to getting ES running again by applying my versions of the necessary resources:
$ k apply -f elastic-search.configmap.yml -n monitoring
$ k apply -f elastic-search.serviceaccount.yaml -n monitoring
$ k apply -f elastic-search.svc.yaml -n monitoring
$ k apply -f elastic-search.statefulset.yaml -n monitoring
After revisiting the only seemingly maxConcurrentShardRequests Kibana Github issue, I figure that ignoring ANY warnings related to discovery were against my best interest, so I filled out the configuration as best as I could, and got down to 0 warnings/errors at startup.
For what’s actually in those resource configs, check the end of the post. Getting ES up and running was actually pretty pain-free this time around – let’s hope I can keep this up.
Now that ES is up and running, let’s get something else to validate the fact (since I’m clearly not an ES expert). Time to see if Cerebro works! It’s pretty easy to port-forward into the StatefulSet’s pod and connect to Cerebro (which by default runs on port 9000):
$ k port-forward elastic-search-0 9000:9000 -n monitoring
I was greeted by a convenient UI in which I input localhost:9200 (the HTTP admin interface for ES), and was able to see the cluster:
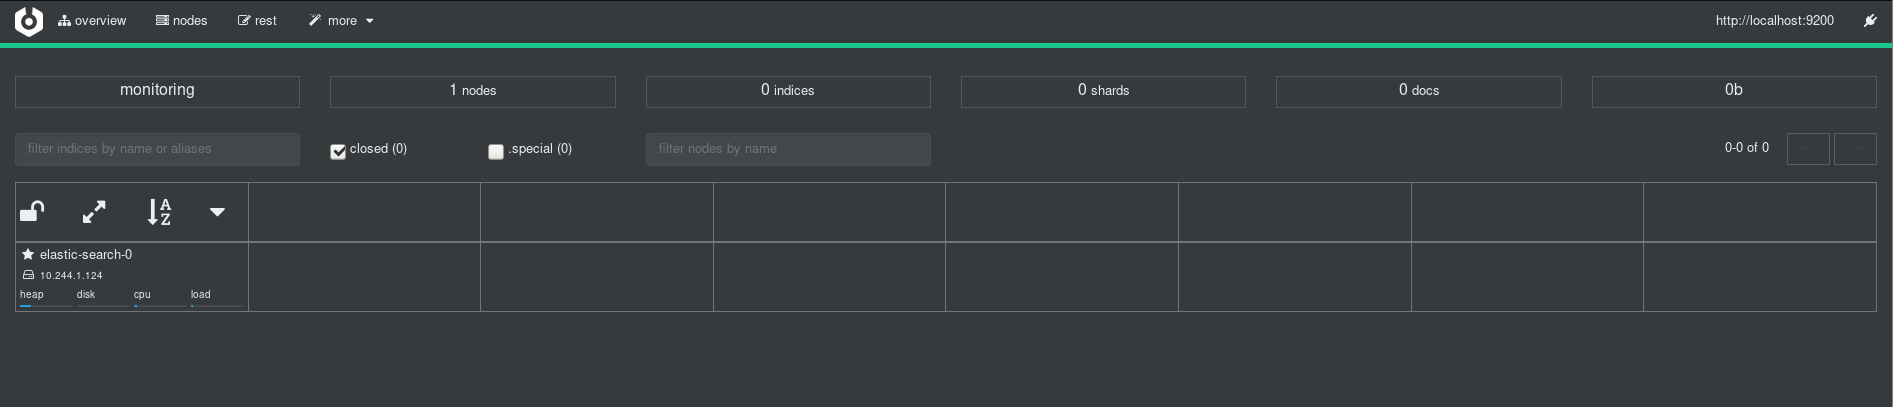
This gives me a reasonable amount of confidence that ES is up – there’s a single node, and it’s accessible over the admin console without much fuss. The metrics which indicate that there are 0 indices, 0 shards, 0 docs don’t worry me so much at present because there’s no data in the system to speak of.
Here’s the stumbling block from last time – I need to get Kibana up and connected to ES.
I’m going to start here like I did for the other resource files, and take a very close look at the configuration. I just noticed a huge issue – I was using http://elasticsearch:9300 in my ConfigMap-backed kibana.yml… It should DEFINITELY be http://elasticsearch:9200. I’m going to be pretty disappointed in myself if this simple mistake is what has been holding me back the whole time. Though it looks like the container I am actually running (blacktop/kibana) actually isn’t using that config, so maybe I’m safe.
Since I’ve turned of XPack to make things simpler, I’ve removed the configuration of username and password for ES. The rest of the configuration file is basically commented out (as per the default generated file you’d get). So it’s time to apply all the necessary configs again:
$ k apply -f kibana.configmap.yaml -n monitoring
$ k apply -f kibana.svc.yaml -n monitoring
$ k apply -f kibana.deployment.yaml -n monitoring
These commands run without so much as an error, and I can port-forward to the kibana pod:
$ k port-forward kibana 5601:5601 -n monoring
And weirdly enough EVERYTHING WORKS. I no longer see the maxConcurrentShardRequests error, and Kibana is displaying normally. I think the incorrect Elastic Search configuration is what did it (and not the port difference for Kibana).
Now it’s time to spin up that python container in the default namespace, and make sure that I can push data!
$ k run --rm -it --image=alpine test-efk
/ # apk --update add py2-pip
fetch http://dl-cdn.alpinelinux.org/alpine/v3.7/main/x86_64/APKINDEX.tar.gz
fetch http://dl-cdn.alpinelinux.org/alpine/v3.7/community/x86_64/APKINDEX.tar.gz
(1/12) Installing libbz2 (1.0.6-r6)
(2/12) Installing expat (2.2.5-r0)
(3/12) Installing libffi (3.2.1-r4)
(4/12) Installing gdbm (1.13-r1)
(5/12) Installing ncurses-terminfo-base (6.0_p20171125-r0)
(6/12) Installing ncurses-terminfo (6.0_p20171125-r0)
(7/12) Installing ncurses-libs (6.0_p20171125-r0)
(8/12) Installing readline (7.0.003-r0)
(9/12) Installing sqlite-libs (3.21.0-r0)
(10/12) Installing python2 (2.7.14-r2)
(11/12) Installing py-setuptools (33.1.1-r1)
(12/12) Installing py2-pip (9.0.1-r1)
Executing busybox-1.27.2-r7.trigger
OK: 62 MiB in 23 packages
/ # pip install fluent-logger
Collecting fluent-logger
  Downloading fluent_logger-0.9.2-py2.py3-none-any.whl
Collecting msgpack (from fluent-logger)
  Downloading msgpack-0.5.6.tar.gz (138kB)
    100% |████████████████████████████████| 143kB 3.5MB/s
Installing collected packages: msgpack, fluent-logger
  Running setup.py install for msgpack ... done
Successfully installed fluent-logger-0.9.2 msgpack-0.5.6
/ # python
Python 2.7.14 (default, Dec 14 2017, 15:51:29)
[GCC 6.4.0] on linux2
Type "help", "copyright", "credits" or "license" for more information.
>>> from fluent import sender
>>> logger = sender.FluentSender('app', host='<Node IP>', port=24224)
>>> logger.emit('log', {'from': 'app', 'test': 'log'})
True
So according to this, everythings worked (on the FluentD side), time to check in with ES (via Cerebro) and Kibana.
Here’s what Cerebro looks like after (the port-forward was going the whole time, I did need to refresh the page):
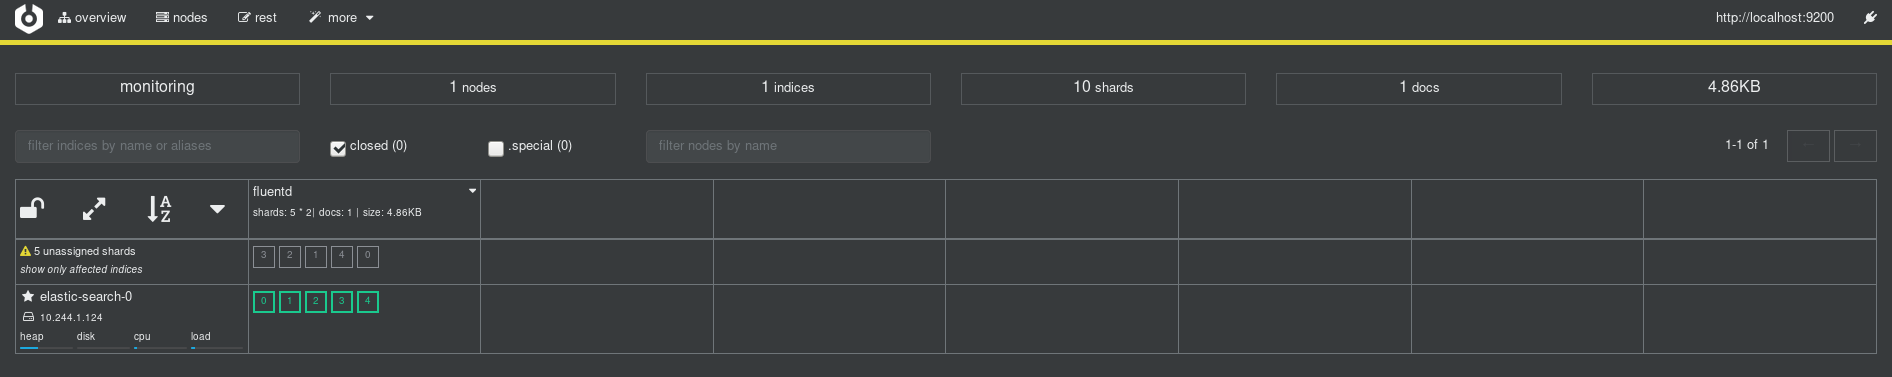
Awesome! I can clearly see the one piece of data went in, and I have shards, indices, and everything I’d expect (from my very limited ElasticSearch knowledge).
Now for the big test, let’s check out if Kibana can see the datum. Since the port forward has been running the whole time, I can head to localhost:5601 and check things out. I last left Kibana on the Management page window, which allows you to click a button to “Check for new Data”:
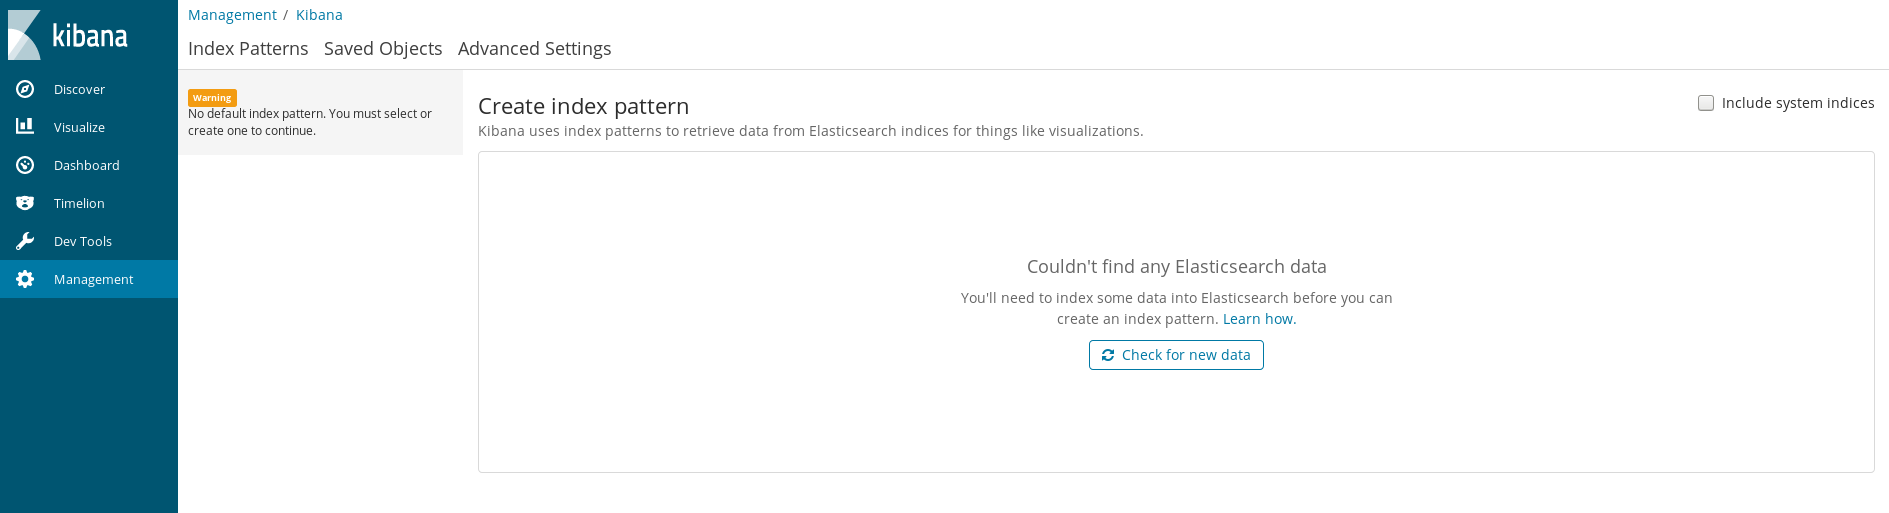
After a click… I get shown the Kibana Index Pattern definition guide!
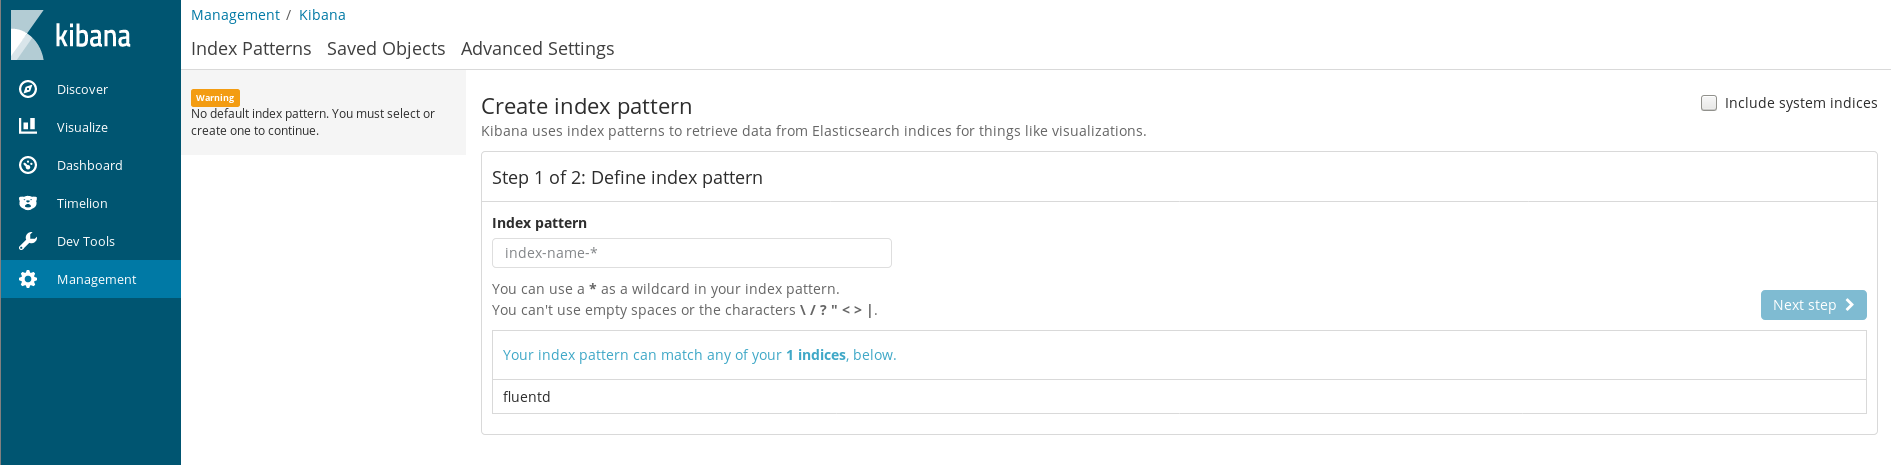
Wow, I basically inflicted a lot of pain on myself setting up EFKK for no reason, but I’m glad it’s finally working. How easy it was to do this with a fresh look is more than a little embarassing.
And a quick click on the Discover page and I can see the log:
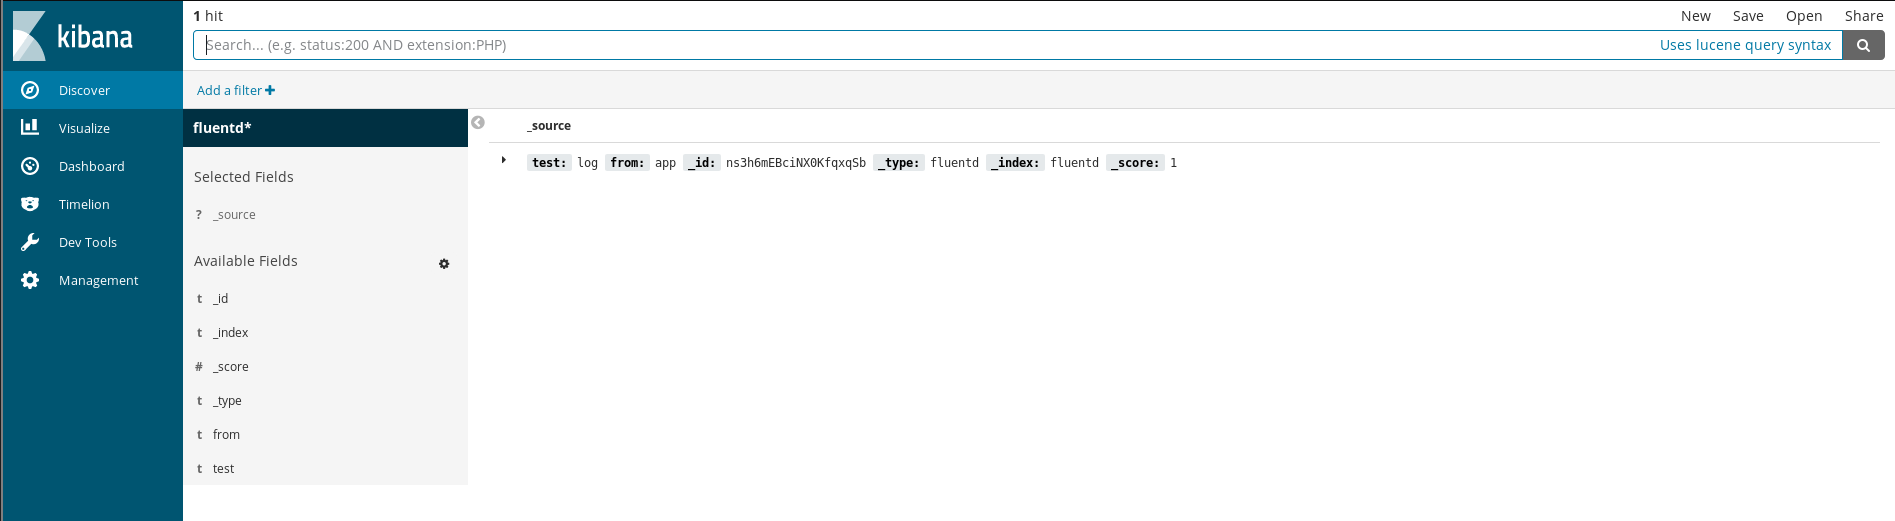 .
.
I’m super glad to have gotten this infrastructure bit up and running, and now I can log happily from my apps. Unfortunately, this post has gotten so long that I’m not going to cover the Haskell integration (all you saw was python), but I’m sure that will be the subject of a future post.
There has been A LOT of wandering around in the wilderness in this post. If you read through all of it, you might possess sympathy levels that are off the charts, or just be a huge masochist. Either way, thanks for sticking around.
Here are the final (working) configurations that get me to this single node EFKK cluster:
fluentd.configmap.yaml
apiVersion: v1
kind: ConfigMap
metadata:
  name: fluentd-es-config
  namespace: monitoring
data:
  fluent.conf: |-
    <source>
      @type forward
      @id input1
      @label @mainstream
      port 24224
    </source>

    <filter **>
      @type stdout
    </filter>

    <label @mainstream>

      <match app.*>
         @type elasticsearch
         host elasticsearch.monitoring
         port 9200
         index_name fluentd
         type_name fluentd
       </match>

      <match **>
         @type file
         @id output1
         path /fluentd/log/data.*.log
         symlink_path /fluentd/log/data.log
         append true
         time_slice_format %Y%m%d
         time_slice_wait 10m
         time_format %Y%m%dT%H%M%S%z
         buffer_path /fluentd/log/data.*.log
       </match>

    </label>
fluentd.serviceaccount.yaml
---
apiVersion: v1
kind: ServiceAccount
metadata:
  name: fluentd
  namespace: monitoring
fluentd.ds.yaml
---
apiVersion: apps/v1
kind: DaemonSet
metadata:
  name: fluentd
  namespace: monitoring
  labels:
    name: default-fluentd
    app: fluentd
    resource: logs
spec:
  # Service
  selector:
    matchLabels:
      app: fluentd
      tier: logging
  # Pod
  template:
    metadata:
      labels:
        app: fluentd
        tier: logging
        resource: logs
      annotations:
        scheduler.alpha.kubernetes.io/critical-pod: '' # logging's pretty important
    spec:
      serviceAccountName: fluentd
      terminationGracePeriodSeconds: 120
      containers:
      - name: fluentd
        image: k8s.gcr.io/fluentd-elasticsearch:v2.0.4
        resources:
          limits:
            cpu: "1"
            memory: "500Mi"
        env:
          - name: FLUENTD_ARGS
            value: --no-supervisor -q
          - name: FLUENTD_CONF
            value: "fluent.conf"
        ports:
        - containerPort: 24224
          hostPort: 24224
          protocol: UDP
        - containerPort: 24224
          hostPort: 24224
          protocol: TCP
        volumeMounts:
          - name: fluentd-logs
            mountPath: /fluentd/log
          - name: config
            mountPath: /etc/fluent/config.d
      volumes:
      - name: fluentd-logs
        emptyDir: {}
      - name: config
        configMap:
          name: fluentd-es-config
That’s all it takes to get FluentD running on each node in your cluster (via a DaemonSet of course ). Each individual client can either attempt to connect to FluentD by the Node IP (insertable in the resource definition to a ENV var or whatever else), and send logs to FluentD, which will forward them to…
elastic-search.configmap.yml
---
apiVersion: v1
kind: ConfigMap
metadata:
  name: elastic-search-config
  namespace: monitoring
data:
  elastic.yml: |
    ---
    cluster:
      name: ${CLUSTER_NAME}

    node:
      master: ${NODE_MASTER}
      data: ${NODE_DATA}
      name: ${NODE_NAME}
      ingest: ${NODE_INGEST}
      max_local_storage_nodes: ${MAX_LOCAL_STORAGE_NODES}

    processors: ${PROCESSORS:1}

    network.host: ${NETWORK_HOST}

    path:
      data: /data/data
      logs: /data/log

    bootstrap:
      memory_lock: ${MEMORY_LOCK}

    # Disable distribution
    index.number_of_replicas: 0

    http:
      enabled: ${HTTP_ENABLE}
      compression: true
      cors:
        enabled: ${HTTP_CORS_ENABLE}
        allow-origin: ${HTTP_CORS_ALLOW_ORIGIN}
        allow-credentials: true
        allow-headers: X-Requested-With,X-Auth-Token,Content-Type, Content-Length, Authorization

    xpack:
      security: false

    discovery:
      zen:
        ping.unicast.hosts: ${DISCOVERY_SERVICE}
        minimum_master_nodes: ${NUMBER_OF_MASTERS}
elastic-search.pvc.yaml
---
apiVersion: v1
kind: PersistentVolumeClaim
metadata:
  name: elastic-search-pvc
  namespace: monitoring
  labels:
    app: elastic-search
spec:
  storageClassName: rook-block
  accessModes:
  - ReadWriteOnce
  resources:
    requests:
      storage: 10Gi
elastic-search.serviceaccount.yaml
---
apiVersion: v1
kind: ServiceAccount
metadata:
  name: elastic-search
  namespace: monitoring
  labels:
    k8s-app: elastic-search
    kubernetes.io/cluster-service: "true"
    addonmanager.kubernetes.io/mode: Reconcile

---
kind: ClusterRole
apiVersion: rbac.authorization.k8s.io/v1
metadata:
  name: elastic-search
  labels:
    k8s-app: elastic-search
    kubernetes.io/cluster-service: "true"
    addonmanager.kubernetes.io/mode: Reconcile
rules:
- apiGroups:
  - ""
  resources:
  - "services"
  - "namespaces"
  - "endpoints"
  verbs:
  - "get"

---
kind: ClusterRoleBinding
apiVersion: rbac.authorization.k8s.io/v1
metadata:
  namespace: monitoring
  name: elastic-search
  labels:
    k8s-app: elastic-search
    kubernetes.io/cluster-service: "true"
    addonmanager.kubernetes.io/mode: Reconcile
subjects:
- kind: ServiceAccount
  name: elastic-search
  namespace: monitoring
  apiGroup: ""
roleRef:
  kind: ClusterRole
  name: elastic-search
  apiGroup: ""
elastic-search.statefulset.yaml
---
apiVersion: apps/v1
kind: StatefulSet
metadata:
  name: elastic-search
  namespace: monitoring
  labels:
    name: elastic-search
    app: elastic-search
    tier: logging
    resource: logging
spec:
  replicas: 1
  serviceName: elasticsearch
  selector:
    matchLabels:
      app: elastic-search
      tier: logging
  template:
    metadata:
      labels:
        app: elastic-search
        tier: logging
    spec:
      initContainers:
      - name: init-sysctl
        image: busybox:1.27.2
        command:
        - sysctl
        - -w
        - vm.max_map_count=262144
        securityContext:
          privileged: true
      # Service Account
      serviceAccount: elastic-search
      terminationGracePeriodSeconds: 120
      # Containers

      containers:
      - name: cerebro
        image: yannart/cerebro:0.6.4
        ports:
          - containerPort: 9000
            name: es-cerebro
      - name: es
        image: quay.io/pires/docker-elasticsearch-kubernetes:6.1.2
        resources:
          limits:
            cpu: "2"
            memory: "4Gi"
        ports:
        - containerPort: 9300
          name: transport
        - containerPort: 9200
          name: http
        env:
        - name: NAMESPACE
          valueFrom:
            fieldRef:
              fieldPath: metadata.namespace
        - name: NODE_NAME
          valueFrom:
            fieldRef:
              fieldPath: metadata.name
        - name: CLUSTER_NAME
          value: monitoring
        - name: DISCOVERY_SERVICE
          value: elasticsearch
        - name: NUMBER_OF_MASTERS
          value: "1"
        - name: NODE_MASTER
          value: "true"
        - name: NODE_DATA
          value: "true"
        - name: NODE_INGEST
          value: "true"
        - name: NETWORK_HOST
          value: "0.0.0.0"
        - name: HTTP_ENABLE
          value: "true"
        - name: HTTP_CORS_ALLOW_ORIGIN
          # value: "/https?:\/\/localhost(:[0-9]+)?/"
          value: "*"
        - name: ES_JAVA_OPTS
          value: -Xms512m -Xmx512m
        - name: "node.local"
          value: "true"
        - name: "discovery.type"
          value: single-node
        - name: "transport.type"
          value: local
        - name: "discovery.zen.multicast"
          value: "false"
        - name: "discovery.zen.ping.unicast.hosts"
          value: elasticsearch
        volumeMounts:
        - mountPath: /data
          name: esdata
        - mountPath: /etc/elasticsearch/config
          name: config
      # Volumes
      volumes:
      - name: esdata
        persistentVolumeClaim:
          claimName: elastic-search-pvc
      - name: config
        configMap:
          name: elastic-search-config
elastic-search.svc.yaml
---
apiVersion: v1
kind: Service
metadata:
  name: elasticsearch
  namespace: monitoring
  labels:
    name: elastic-search
    tier: logging
spec:
  clusterIP: None
  selector:
    app: elastic-search
    tier: logging
  ports:
  - protocol: TCP
    port: 9200
    targetPort: 9200
    name: elasticsearch-http
  - protocol: TCP
    port: 9300
    targetPort: 9300
    name: elasticsearch
  - protocol: TCP
    port: 9000
    targetPort: 9000
    name: es-cerebro
kibana.configmap.yaml (basically ripped from the default with very minimal changes/uncommenting)
---
apiVersion: v1
kind: ConfigMap
metadata:
  name: kibana-config
  namespace: monitoring
data:
  kibana.yml: |
    ---
    # Disable xpack
    xpack:
      security: false

    # Kibana is served by a back end server. This setting specifies the port to use.
    server.port: 5601

    # Specifies the address to which the Kibana server will bind. IP addresses and host names are both valid values.
    # The default is 'localhost', which usually means remote machines will not be able to connect.
    # To allow connections from remote users, set this parameter to a non-loopback address.
    server.host: 0.0.0.0

    # Enables you to specify a path to mount Kibana at if you are running behind a proxy. This only affects
    # the URLs generated by Kibana, your proxy is expected to remove the basePath value before forwarding requests
    # to Kibana. This setting cannot end in a slash.
    #server.basePath: ""

    # The maximum payload size in bytes for incoming server requests.
    #server.maxPayloadBytes: 1048576

    # The Kibana server's name.  This is used for display purposes.
    #server.name: "your-hostname"

    # The URL of the Elasticsearch instance to use for all your queries.
    elasticsearch.url: http://elasticsearch:9200

    # When this setting's value is true Kibana uses the hostname specified in the server.host
    # setting. When the value of this setting is false, Kibana uses the hostname of the host
    # that connects to this Kibana instance.
    #elasticsearch.preserveHost: true

    # Kibana uses an index in Elasticsearch to store saved searches, visualizations and
    # dashboards. Kibana creates a new index if the index doesn't already exist.
    #kibana.index: ".kibana"

    # The default application to load.
    #kibana.defaultAppId: "discover"

    # If your Elasticsearch is protected with basic authentication, these settings provide
    # the username and password that the Kibana server uses to perform maintenance on the Kibana
    # index at startup. Your Kibana users still need to authenticate with Elasticsearch, which
    # is proxied through the Kibana server.
    # elasticsearch.username: "elastic"
    # elasticsearch.password: "thisisabadpassword"

    # Enables SSL and paths to the PEM-format SSL certificate and SSL key files, respectively.
    # These settings enable SSL for outgoing requests from the Kibana server to the browser.
    #server.ssl.enabled: false
    #server.ssl.certificate: /path/to/your/server.crt
    #server.ssl.key: /path/to/your/server.key

    # Optional settings that provide the paths to the PEM-format SSL certificate and key files.
    # These files validate that your Elasticsearch backend uses the same key files.
    #elasticsearch.ssl.certificate: /path/to/your/client.crt
    #elasticsearch.ssl.key: /path/to/your/client.key

    # Optional setting that enables you to specify a path to the PEM file for the certificate
    # authority for your Elasticsearch instance.
    #elasticsearch.ssl.certificateAuthorities: [ "/path/to/your/CA.pem" ]

    # To disregard the validity of SSL certificates, change this setting's value to 'none'.
    #elasticsearch.ssl.verificationMode: full

    # Time in milliseconds to wait for Elasticsearch to respond to pings. Defaults to the value of
    # the elasticsearch.requestTimeout setting.
    #elasticsearch.pingTimeout: 1500

    # Time in milliseconds to wait for responses from the back end or Elasticsearch. This value
    # must be a positive integer.
    #elasticsearch.requestTimeout: 30000

    # List of Kibana client-side headers to send to Elasticsearch. To send *no* client-side
    # headers, set this value to [] (an empty list).
    #elasticsearch.requestHeadersWhitelist: [ authorization ]

    # Header names and values that are sent to Elasticsearch. Any custom headers cannot be overwritten
    # by client-side headers, regardless of the elasticsearch.requestHeadersWhitelist configuration.
    #elasticsearch.customHeaders: {}

    # Time in milliseconds for Elasticsearch to wait for responses from shards. Set to 0 to disable.
    #elasticsearch.shardTimeout: 0
    #elasticsearch.maxConcurrentShardRequests: 5

    # Time in milliseconds to wait for Elasticsearch at Kibana startup before retrying.
    #elasticsearch.startupTimeout: 5000

    # Specifies the path where Kibana creates the process ID file.
    #pid.file: /opt/bitnami/kibana/tmp/kibana.pid

    # Enables you specify a file where Kibana stores log output.
    #logging.dest: stdout

    # Set the value of this setting to true to suppress all logging output.
    #logging.silent: false

    # Set the value of this setting to true to suppress all logging output other than error messages.
    #logging.quiet: false

    # Set the value of this setting to true to log all events, including system usage information
    # and all requests.
    #logging.verbose: false

    # Set the interval in milliseconds to sample system and process performance
    # metrics. Minimum is 100ms. Defaults to 5000.
    #ops.interval: 5000

    # The default locale. This locale can be used in certain circumstances to substitute any missing
    # translations.
    #i18n.defaultLocale: "en"
kibana.pod.yaml
---
apiVersion: v1
kind: Pod
metadata:
  name: kibana
  namespace: monitoring
spec:
  containers:
    - name: kibana
      image: blacktop/kibana:6.1.3
      env:
        - name: CLUSTER_NAME
          value: monitoring
        - name: ELASTICSEARCH_URL
          value: http://elasticsearch:9200
        - name: SERVER_BASEPATH
          value: /api/v1/namespaces/monitoring/services/kibana
      ports:
      - containerPort: 5601
        name: ui
        protocol: TCP
kibana.svc.yaml
---
apiVersion: v1
kind: Service
metadata:
  name: kibana
  namespace: monitoring
  labels:
    app: kibana
    kubernetes.io/cluster-service: "true"
    addonmanager.kubernetes.io/mode: Reconcile
    kubernetes.io/name: "Kibana"
spec:
  ports:
  - port: 5601
    protocol: TCP
    targetPort: ui
  selector:
    app: kibana
While I’m glad I was able to get the stack set up, it’s worth noting that this setup is not very secure at all. There are at least a few things you should do to actually start using something like this in production that I haven’t included:
NetworkPolicy resources to restrict traffic, and maybe even an integration like Istio to enable mutual TLS authentication transparently between EFKK internally and your apps as they talk to FluentD.So it’s been one heck of a long ride, but I’m super excited to finally have some reasonably standard monitoring running on my small kubernetes cluster. It still feels good and rewarding to work my way through Kubernetes resource configs (which admittedly isn’t the point of Kubernetes, you’re supposed to build stuff on top of it and not really worry about it), and I feel like I’ve learned a lot.