DDG search drop in powered by ddg.patdryburgh.com
tl;dr - I spent a bunch of time stumbling through getting kim/opentracing integrated into my small Servant powered web app. In the end I actually switched to servant-tracing due to some issues integrating, and was able to get it working – there’s a TON of wandering in this post (basically half the time you’re reading an approximation of my stream of consciousness, some might consider the experiments with kim/opentracing a waste of time, but I do not), so please check out the tldr section for the working code that uses servant-tracing (somewhat specialized to my app structure).
This is Part 3 in a series of blog posts where I seek to increase observability for applications running on my single-node Kubernetes cluster. While the scale isn’t large, it’s perfect for learning how to learning better operations practices at a leisuerly pace. In particular, this post will cover adding support for request tracing to an existing application running in the cluster, with the help of OpenTracing standard, by running & using Jaeger..
As everything old becomes new again, one thing recently gaining visibility is having a principled approach to tracing – the simple process of recording durations of pieces of code that handle a certain path or functionality in an application. This is basically just good reliability engineering and the term is pretty generic, but in this post I’ll be focusing on the kind of tracing that most happens often in a web application, following a single request through one or more internal systems to see how time is spent.
The concept is pretty simple, and you could do it inside of one application by just printing out when methods start and end (along with durations of course) and reading the logs, but aside from the obvious reasons not to do something so ad-hoc these days there are some pretty great tools offer considered approaches to tracing. I think it’s crucial to always be familiar with the simplest version of any task you want to achieve, before going for the more complicated solution – so it’s important to me to at least note this point before going into writing lots of code and standing up a standalone service that helps with tracing (given the simplicity of the tools like Jaeger I think the increased complexity burden is not very high).
Before we get into this, I want to point out that there are solutions out there (that I plan to employ in the future) that do this along with many other functions, quite automatically for you in k8s land. One of the most heavily hyped (currently at least) of those tools is istio. While I think istio is a cool project, and I’m definitely going to be checking it out and writing about it in the future, I think it’s important for me to get hands on with manually setting up a OpenTracing compliant service, and wiring up a single application to make the appropriate calls, just to get a feel, before moving up to more complicated approaches.
There are lot sof ways you could go about tracing systems. OpenTracing is an effort to standardize the methodology and tools for this kind of application measuring. While it might seem to be only gaining mass appeal now (it did to me), but that just means engineering orgs you’ve been in haven’t been at the top of their game – taking time to engineer for observability is a quality shared by excellent engineering organizations – not every company has the money or the expertise.
As always, the first step is to find & read/skim the relevant documentation and manuals for how everything is going to work/interconnect. Here’s the general plan as far as I see it:
tracing.monitoring.svc in my k8s cluster, so a Service called “tracing” in the Namespace “monitoring”)If these steps don’t seem obvious to you, maybe take a look at some of these resources:
I’m keeping it pretty light on documentation, because I think the concept is pretty simple – set up the service, send traces to it, view the traces (jaeger has a built in web UI which is nice). Let’s dive into it.
Jaeger does indeed have a helm chart, but since I don’t like using Helm charts, at least for my first time setting up a service, let’s get everything running manually.
First a look at the internal dialog I have when starting to write a resource definition for Kubernetes:
Question: In which Namespace is Jaeger going to live?
Answer: Going to use monitoring, it already exists so I’m good, no need to make a monitoring.ns.yaml resource definition
Question: What’s the minimal set of k8s concepts/resources will I likely need to create? A Pod?
Answer: Obviously yes, will need to actually run Jaeger somehow – theoretically we could run with ONLY a pod. It’s probably a good idea to also tack a Service on there so the pod can be accessed by DNS name.
Question: Regular Deployment? StatefulSet? DaemonSet?
Answer: I don’t think a DaemonSet/StatefulSet is necessary – I probably only need one instance of Jaeger running per-cluster, I don’t even think I need multiple replicas but let’s go for a Deployment so I get some advanced replication/deployment capabilities
OK, so now that I’ve got an idea of what I want, Here’s what it looks like to adapt the relatively straight-forward getting started documentation into k8s resource definition yaml for a single deployment:
jaeger.deployment.yaml:
---
apiVersion: apps/v1
kind: Deployment
metadata:
  namespace: monitoring
  name: jaeger
  labels:
    app: jaeger
spec:
  replicas: 1
  selector:
    matchLabels:
      app: jaeger
  template:
    metadata:
      labels:
        app: jaeger
    spec:
      containers:
      - name: jaeger
        image: jaegertracing/all-in-one:1.3.0
        imagePullPolicy: IfNotPresent
        resources:
          limits:
            cpu: 500m
            memory: 500Mi
          requests:
            cpu: 500m
            memory: 500Mi
        env:
        - name: COLLECTOR_ZIPKIN_HTTP_PORT
          value: "9411"
jaeger.svc.yaml:
---
apiVersion: v1
kind: Service
metadata:
  namespace: monitoring
  name: jaeger
  labels:
    app: jaeger
spec:
  selector:
    app: jaeger
  ports:
    - name: jaeger-agent-thrift
      protocol: UDP
      port: 6831
    - name: jaeger-query
      protocol: TCP
      port: 16686
    - name: jaeger-collector
      protocol: TCP
      port: 14268
Note that I’m using jaegertracing/all-in-one:1.3.0 (I make it a habit not to use latest, but always pick a proper version, even if it’s just latest-that-day), but Jaeger in this form is actually 3 distinct components working together, as discussed in the deployment docs. The jaeger-agent, jaeger-collector, and jaeger-query components all work together, and if I wanted to implement my own versions or swap out one of those pieces I definitely could – but I won’t be for just getting this running. I’m also opting to use the in-memory persistence defaults – it’s also pretty easy (supposedly) to hook up Jaeger with a backend like ElasticSearch, which I got running in a previous post while setting up the EFKK stack… I’m not going to test that in this blog post.
While writing the Service resource, I realized that while I was going for a simple Pod + Service setup, the more appropriate setup would probably be to not deploy as all-in-one, but run the jaeger-agent as a DaemonSet, and let it handle Jaeger information on every node in the cluster (if I had a bigger cluster), and run the jaeger collector/query in one or more places. Since I only have a single node and pretty modest performance needs, I’m going to stay with the all-in-one setup.
Now that Jaeger was supposedly running, I kubectl port-forwarded my way in, expecting to see the web interface:
$ kubectl port-forward jaeger-6bcf5fbf69-pp7t8 -n monitoring 8080:16686
Easy peasy, it’s up:
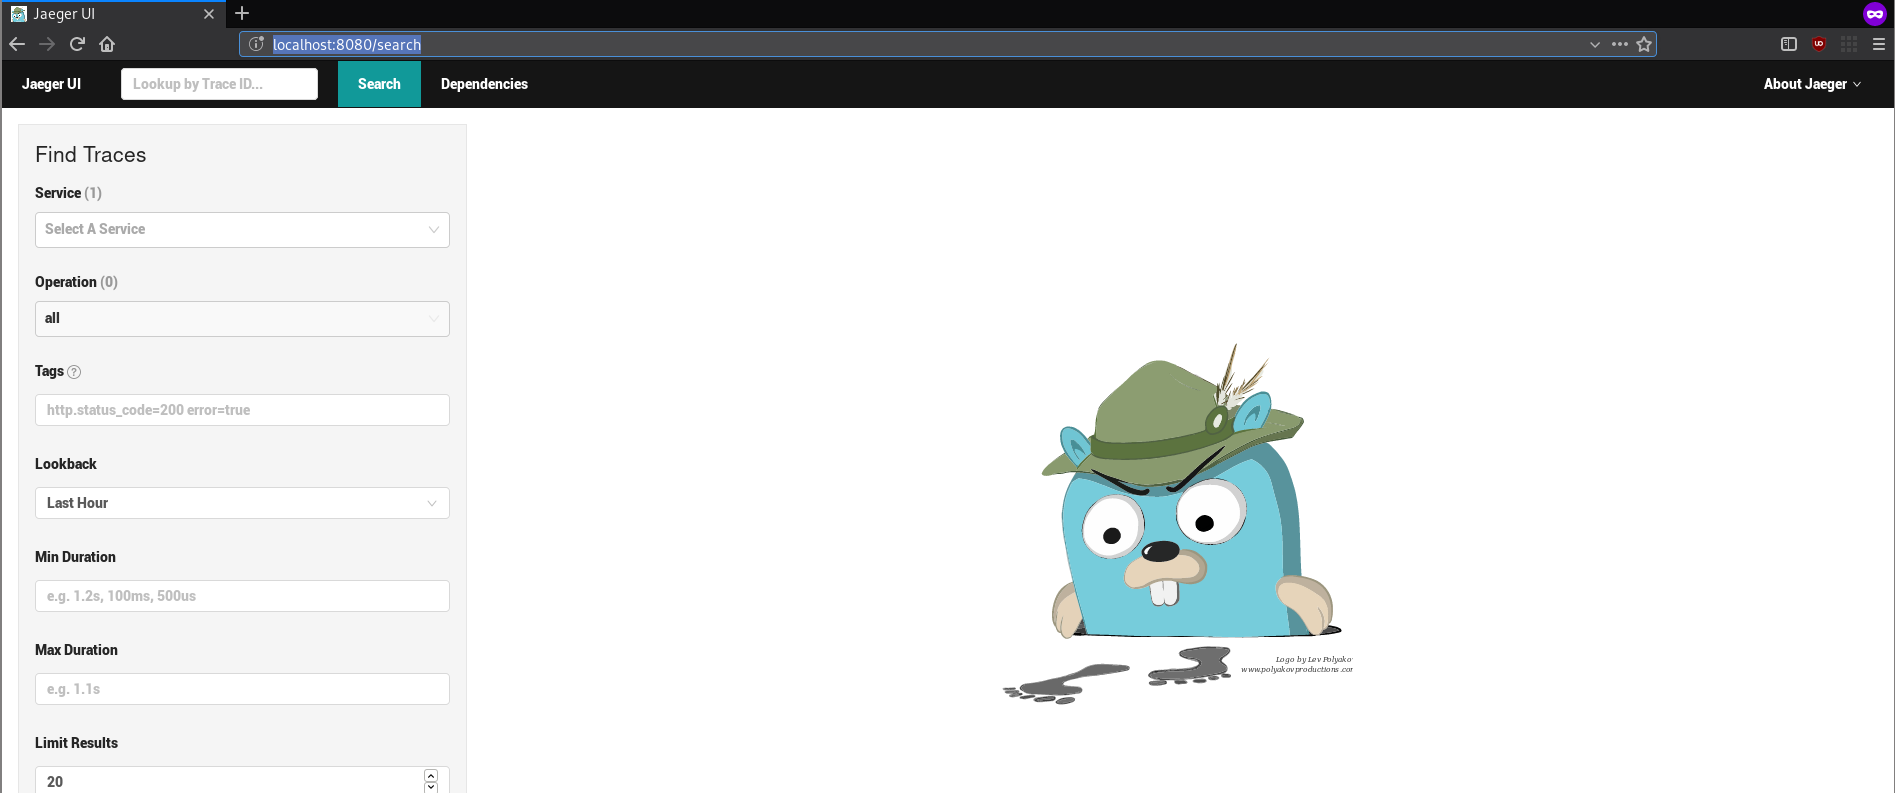
So it’s up, but what do the logs look like? I wonder if there isn’t anything in there that might be wrong:
{ "level": "info","ts":1522581698.024786,"caller": "tchannel/builder.go:89","msg": "Enabling service discovery","service": "jaeger-collector"}
{ "level": "info","ts":1522581698.0249045,"caller": "peerlistmgr/peer_list_mgr.go:111","msg": "Registering active peer","peer": "127.0.0.1:14267"}
{ "level": "info","ts":1522581698.0260403,"caller": "standalone/main.go:171","msg": "Starting agent"}
{ "level": "info","ts":1522581698.02752,"caller": "standalone/main.go:210","msg": "Starting jaeger-collector TChannel server","port":14267}
{ "level": "info","ts":1522581698.0276124,"caller": "standalone/main.go:220","msg": "Starting jaeger-collector HTTP server","http-port":14268}
{ "level": "info","ts":1522581698.0325587,"caller": "standalone/main.go:280","msg": "Registering metrics handler with jaeger-query HTTP server","route": "/metrics"}
{ "level": "info","ts":1522581698.0325975,"caller": "standalone/main.go:286","msg": "Starting jaeger-query HTTP server","port":16686}
{ "level": "info","ts":1522581698.218983,"caller": "standalone/main.go:239","msg": "Listening for Zipkin HTTP traffic","zipkin.http-port":9411}
{ "level": "info","ts":1522581699.0251544,"caller": "peerlistmgr/peer_list_mgr.go:157","msg": "Not enough connected peers","connected":0,"required":1}
{ "level": "info","ts":1522581699.025209,"caller": "peerlistmgr/peer_list_mgr.go:166","msg": "Trying to connect to peer","host:port": "127.0.0.1:14267"}
{ "level": "info","ts":1522581699.0255947,"caller": "peerlistmgr/peer_list_mgr.go:176","msg": "Connected to peer","host:port": "[::]:14267"}
Everything looks good to me! And they’re using structured logging via JSON (as opposed to the key=value formats that some structured logging approaches use) so that’s pretty cool. I need to look into doing more structured logging in my applications, I think most apps I write these days ship logs off, but still log locally with non-structured strings.
I really love this kind of setup process, it’s exactly what I want out of almost all self-hostable apps I run. Let me set the thing up, give me an endpoint to hit and show me the project or let me complete setup. I find that Jaeger is right at that intersection of easy to deploy (thanks to Golang), relatively simple with local in-memory options (thanks to the developers), and with minimal configuration and a web interface that works out of the box.
This felt a little too easy, but I’m going to assume everything’s good and move on to the next bit, instrumenting my application
OK, now that Jaeger is running, let’s start sending stuff to it. One of the latest projects I’ve been working on is a super simple Job Board application, written in Haskell, and that’s going to be the guinea pig today. Obligatory Haskell plug – it’s amazing, if not only for the things it will do with your brain (Learn You A Haskell For Great Good is a great excellent starting text) – it encourages (and sometimes forces) you to think in a way that will likely make you a better programmer, while exposing you more deeply to the functional paradigm. OK enough gushing about haskell. My application uses Servant which is an awesome library for building APIs with Haskell – it uses some high level type machinery to give you clean, composable, reusable, and ergonomic management of endpoints (routes), handlers (functions that run when someone hits the endpoing), and is pretty great to use. I love using servant, and the contributors are very nice, knowledgable, and pragmatic – a joy to interact with and help where I can.
The best application of tracing often comes after doing some profiling/debugging, finding long paths in the app, and doing careful measuring to determine where you want to profile. Since I don’t have any such error case, and this approach isn’t anywhere near that structured, I’m just going to trace everything. There are those that think it’s better to just trace everything (if you can afford it, resource wise), so I guess I’m doing right by those people.
My plan is to enable support for WAI-level tracing by using the haskell-opentracing library – mostly because I’m pretty lazy and want a quick win. Also, I want to point out how far Haskell has come, while a lot of people consider the language to be too “academic”, these days I don’t have to write my own library to use this currently trending tech! I do sometimes worry that I should write a Haskell library some day so that I can at least experience how to write one, but for now I’m happy to use the existing work.
Well my plan didn’t last very long – I realized that there actually a clear “go-to” package that supports opentracing as concretely as I thought. Here are the packaegs I found:
None of these are in the Stack LTS Resolver (8.15, GHC 8.0.2) that I’m using right now – so I may have to include one of these libraries by their github repository. This is going to complicate my build process, since if I use the git repository directly (over SSH) then I’ll need to set up git in the containers that are doing the building – if I use HTTPS I might get rate limited. I maybe could just vendor the code into the project, and see how that works out, just to avoid build/install trouble down the line. A bunch of these repos contain multiple sub-folders with projects in them – most of the solutions have been built modularly as well it seems.
Looks like there’ll be a little bit of work to do to pick one of these and get them working. The most recently modified project with the WAI-capable component (just a middle ware that WAI can use that will trace everything automatically) seems to be kim/opentracing. According to this github issue, the creator of haskell-opentracing notes that his project was more an experiment in using something called Backpack, which I’m not familiar with. servant-tracing says it’s incomplete (and a bunch of kind of critical features are missing it seems), and I’m not sure I like how the code in haskell-service/jaeger is structured. I’m going to go with integrating kim/opentracing. Another option here is to build my own – At this point since I’m really only aiming for the WAI middleware, it would probably be feasible, but since it’s kind of already done, I’m going to focus on integration, rather than creation per say.
After creating a vendor directory in my project, and pulling the repo inside of it (vendor/opentracing), I modified stack.yaml to try to include the required packages:
packages:
- "." # this was there before, how stack knows to build the current folder as a package
- vendor/opentracing/opentracing
- vendor/opentracing/opentracing-wai
After adding this, the subsequent stack build (or stack ghci) build the local package (with no issues :) ). I also assume that building the package isn’t enough, I need to make sure it’s included as a dependency in the API’s .cabal file, so I added the following lines:
library
hs-source-dirs:      src
                   , test
exposed-modules:     Util
                   , Lib
                   , Auth
                   , Cache.CacheBackend
    -- ... lots more modules ...
                   , Errors
build-depends:       aeson
                   , base >= 4.7 && < 5
                   , base64-bytestring
    -- ... lots and lots of modules ...
                   , opentracing
                   , opentracing-wai
After running stack ghci one more time, it looks like everything is good! Time to dig in to the code in the library.
This is normally the phrase that good documentation would shine, but the project is still pretty easly and doesn’t have docs yet. I considered filing a ticket on it but I’d rather not till I could at least be the person to contribute it, I’d like to get a grasp of the library first, I’m sure @kim is busy working on stuff too. You’re about to read my notes wandering through the codebase trying to figure it out, so I’m warning you now, you might want to skip this section.
The first file that made sense to look at was opentracing-wai/Network/Wai/Middleware/OpenTracing.hs. Looking at that meant that I was not entering the world of kim/opentracing and the castles of types they had built were mine to explore.
The most prominent definition was:
type TracedApplication = ActiveSpan -> Application

opentracing
    :: HasCarrier Headers p
    => Tracer
    -> Propagation        p
    -> TracedApplication
    -> Application
opentracing t p app req respond = do
    let ctx = Propagation.extract p (requestHeaders req)
let opt = let name = Text.intercalate "/" (pathInfo req)
-- ... lots more code ...
Doing a bit of unwrapping in my mind, that means the opentracing function has this type signature:
opentracing :: Tracer -> Propagation p -> (ActiveSpan -> Application) -> Application`
If I remember correctly for type signatures, you can drop the ( )s, so once we do that, we see the ususal Application -> Application WAI middleware come out. If I’m reading and understanding this correctly, I need to provide a Tracer, Propogation p, ActiveSpan and my current Application and I should be able to take advantage of the automatic WAI tracing. Only hiccup is that I don’t know what a Tracer, Propogation p (which must satisfy the HasCarrier Headers typeclass by the way), or an ActiveSpan are, time for more digging!
Next files to take a look at:
opentracing/OpenTracing/Tracer.hsopentracing/OpenTracing/Propagation.hsopentracing/OpenTracing/Span.hsI couldn’t make heads or tails of the Tracer/Propogation-related type machinery right away, but one thing that was pretty easy was how to make an ActiveSpan:
newSpan
    :: ( MonadIO  m
       , Foldable t
       )
    => SpanContext
    -> Text
    -> SpanRefs
    -> t Tag
    -> m Span
newSpan ctx op refs ts = do
    t <- liftIO getCurrentTime
    pure Span
        { _sContext   = ctx
        , _sOperation = op
        , _sStart     = t
        , _sTags      = foldMap (`setTag` mempty) ts
        , _sRefs      = refs
        , _sLogs      = mempty
}

newtype ActiveSpan = ActiveSpan { fromActiveSpan :: IORef Span }

mkActive :: Span -> IO ActiveSpan
mkActive = fmap ActiveSpan . newIORef
This chunk of code makes it pretty obvious how to build a Span, and resultingly an ActiveSpan. I’m a little confused on why I should be giving an ActiveSpan so early in the process (remember, I’m trying to write the thing that will convert my application into a traced one on WAI’s terms), I’d expect it to be something generated at every request (not an input to the middleware), but I’ll worry about that later once I have the rest of the pieces of the puzzle. Maybe it’s something I just don’t understand about the OpenTracing spec – maybe there’s a top level span?
Let’s implement just that bit, in the set up area of the application, and get something compiling. I basically got as far as this before realizing I was in over my head:
startApp :: AppConfig -> IO ()
startApp c = do
  -- ... other code ...

  -- TODO: Set up tracing
  span <- OTS.newSpan (OTS.SpanContext traceID spanID Nothing sampled baggage) "toplevel" [] []

  -- ... other code ...
I started looking around at trying to figure out how I was supposed to properly get all the other things but it really seems like I should be running in a Context for this… Before we go down the rabbit hole on figuring out the right way to piece together the requirements for an ActiveSpan (SpanContext and friends), let’s wander back around the library a little bit – let’s put the ActiveSpan input requirement to the side for a bit and work on a different bit of the requirements, the Tracer.
Taking a look at the code in OpenTracing.Tracer, it looks like I can build a Tracer object by providing two functions:
data Tracer = Tracer
    { tracerStart  :: forall m. MonadIO m => SpanOpts     -> m Span
    , tracerReport :: forall m. MonadIO m => FinishedSpan -> m ()
    }
Obviously, I need to provide tracerStart and tracerReport definitions that use (make calls to?) Jaeger. The rest of the code in Tracer.hs is abstracted in pretty mcuh these terms, and it makes sense. Surely there must be specialized versions somewhere? Bingo: OpenTracing.Jaeger.AgentReporter seems to be in the right direction – it’s doing more of what I would expect the library to do, making UDP connections and sending information. Along the way I also stumbled upon OpenTracing.Jaeger.Propagation – it looks like there’s actually a propagation I can use for Jaeger:
jaegerPropagation :: Propagation '[TextMap, Headers]
jaegerPropagation = Carrier _JaegerTextMap :& Carrier _JaegerHeaders :& RNil
I’m not 100% sure, but this is probably an abstraction on how to send the relevant information over to the backend (Zipkin/Jaeger/whatever) – so jaegerPropagation makes sense, it basically codifies the propogation method that Jaeger expects. Looks like we’ve solved the problem of the missing Propogation p along the way!
Some more poking around (in AgentReporter.hs), and I found some pretty useful and intuitive function signatures:
withJaegerAgent
    :: ( MonadIO   m
       , MonadMask m
       )
    => JaegerAgentOptions
    -> (JaegerAgent -> m a)
    -> m a

jaegerAgentReporter :: MonadIO m => JaegerAgent -> FinishedSpan -> m ()
The first withJaegerAgent sounds like it would be perfect to inject a properly configured Jaeger agent into any MonadIO compliant action, so I’m glad I recognize that pattern at least. The next is even better, because it actually solves a bit of the Tracer puzzle! That function signature partially matches the tracerReport one, all I need is to give that second function a JaegerAgent, by way of trusty partial application! I definitely felt lost for a bit but looking at the types, reasoning about them, and trying to fully understand the intent has shown through yet again.
It’s at this point that I stop to note that maybe this is too much to ask for in a production environment… If I’ve got some business-critical reason for tracing or was under a deadline, I think I’d much rather I was in some simpler (AKA less robust) langauge, so I could just plugin in some middleware or framework-supported something that would do the tracing for me without so much worry about good abstraction. I’m almost certain that introducing Jaeger in NodeJS is a two-liner (requireing some library then calling app.use(jaeger-lib(opts). BTW I looked real quick and it’s super duper easy in Golang. Either way, let’s carry on – while I’m not necessarily feeling it now, this hard brain-work is probably definitely good for me, the “aha” moment is probably gonna be pretty good, it will fill me with a sense of pride and accomplishment.
TracingComponent to house kim/opentracing integration codeOK, this next bit is a little bit specific to my application – long story short, I have a monstrosity like this in my application:
data ApplicationGlobals = ApplicationGlobals { globalConfig           :: AppConfig
                                             , globalDBBackend        :: SqliteBackend
                                             , globalMailer           :: MailerBackend
                                             , globalUserContentStore :: UserContentStoreBackend
                                             , globalSearchBackend    :: SQLiteFTS
                                             , globalCacheBackend     :: CacheBackend
                                             , globalMetricsBackend   :: MetricsBackend
                                             , globalLogger           :: Logger
                                             , globalCookieKey        :: WCS.Key
                                             }

type WithApplicationGlobals a = StateT ApplicationGlobals a
That code snipped should tell you all you need to know (a is basicaly Servant’s Handler monad, AKA ExceptT ServantErr IO) – basically I’ve got a bunch of big sections of the app sectioned off into what I call “components” which are mostly created at startup, and I hold immutable references to those objects. The components themselves may contain mutable references like IOVar or TVar, but this is how I avoid using top level global state. There are some less-than-perfect things, which I’ve recently realized with a dive into alternative approaches like the ReaderT Pattern, Oliver Charles’s post on monad transformers/MTL/Free Monads, and Three Layer Haskell Cake, but I’m not going to bundle that refactoring into this blog post.
Anyway, my point was that I’m going to add a component that “handles” tracing to this list, a TracingBackend, so you might want to ignore this part, though you might find it useful. I’ve gone into it in earlier posts, but “adding a component” for me entails a few things, in particular setting up it’s configuration, giving it a Logger to use, etc. All that stuff is superfluous, but what’s really important is that the component needs to hold/generate this JaegerAgent. At the end of the day, I want to be able to call something like this:
startApp :: AppConfig -> IO ()
startApp c = do
  -- ... other code ...

  -- Set up metrics/instrumentation
  tracingLogger <- buildLogger "App.Tracing" (tracingLogLevel tracingCfg)
  tracingBackend <- makeConnectedTracingBackend tracingCfg (Just tracingLogger)

  -- ... other code ...
The startApp action is basically a bunch of those kinds of calls, and then actually starting the app, so this fits in right with the paradigm I’m using. Then, from code, I should be able to pull the TracingBackend object out from ApplicationGlobals (using StateT’s get), and do stuff with it, like starting or finishing a new span if I want, or using some of the other functions provided by the OpenTracing library. I’ll spare you the gory detail of adding the component, but I will go over the important bits.
Another thing I ran into was that including the opentracing-jaeger package required some more imports to stack.yaml (this is somewhat specific to my 8.15 resolver):
extra-deps:
# ... other deps ...
- thrift-0.10.0
- vector-0.10.12.2

# allow-newer wasn't necessary before but is now, due to a library called primitive being already @ v 0.6 in my codebase.
allow-newer: true
After dealing with that, I could add the code enecessary to get the component to type check & compile, though roughly 90% is self-inflicted boilerplate due to how my application is set up:
{-# LANGUAGE OverloadedStrings    #-}

module Tracing.TracingBackend ( makeConnectedTracingBackend
                              , TracingBackend(..)
                              , Tracing(..)
                              ) where

import           Control.Monad.IO.Class
import           Config (TracingConfig(..))
import           Data.Maybe (Maybe, fromMaybe)
import           Data.Monoid ((<>))
import           Network.Wai (Application)
import           System.Log.Logger (Logger, Priority(..))
import           Types (HasLogger(..))
import           OpenTracing.Jaeger.AgentReporter (JaegerAgent, JaegerAgentOptions(..), newJaegerAgent, jaegerAgentOptions, jaoAddr, jaoErrorLog)
import           OpenTracing.Types (Addr(UDPAddr), Port(..))
import           Data.ByteString.Builder
import           Control.Lens.Setter (set)

data TracingBackend = TracingBackend { tracingCfg      :: TracingConfig
                                     , tracingLogger   :: Maybe Logger
                                     , tracingSettings :: TracingSettings
                                     , jaegerAgent     :: JaegerAgent
                                     }

type TracingSettings = JaegerAgentOptions

makeConnectedTracingBackend :: TracingConfig -> Maybe Logger -> IO TracingBackend
makeConnectedTracingBackend cfg maybeL = pure (makeJaegerSettings cfg maybeL)
                                         >>= \settings -> newJaegerAgent settings
                                         >>= pure . TracingBackend cfg maybeL settings

doLogTextBuilder :: Logger -> Builder -> IO ()
doLogTextBuilder l b = return ()

makeJaegerSettings :: TracingConfig -> Maybe Logger -> JaegerAgentOptions
makeJaegerSettings cfg maybeL = set jaoAddr addr options
    where
      serviceName = tracingServiceName cfg
      options = jaegerAgentOptions serviceName
      host = show $ tracingAgentUDPAddr cfg
      port = read $ show $ tracingAgentUDPPort cfg
      addr = UDPAddr host port
      logFn = maybe (\_ -> pure ()) doLogTextBuilder maybeL

class Tracing t where
    getTracingLogger :: t -> Maybe Logger
    getTracingConfig :: t -> TracingConfig

    traceApplication :: t -> Application -> IO Application

instance HasLogger TracingBackend where
    getComponentLogger = tracingLogger

instance Tracing TracingBackend where
    getTracingLogger = tracingLogger
    getTracingConfig = tracingCfg

    -- TODO: check to ensure that app wide tracing is enabled
    traceApplication m app = logMsg m INFO "Instrumenting application..."
                             >> pure app -- TODO: use the opentracing WAI thing
SIDENOTE I’m still trying to figure out if I want to jump into the lens library, but the fact that this library uses it is forcing my hand. I find that most lens walk-throughs are written in a hard to approach way, so I’ve kind of put it off, but now I’m looking at the following resources:
In this case all I had to wrap my head around was set (I didn’t use any special infix operators, just set). It kind of chafes me that the library forced me into this choice but I was over it by the time I got it working.
lens adventures aside, with the JaegerAgentOptions in place, I’m now ready to attempt to make a JaegerAgent that I can actually use. As you can see, I’ve moved the bit that will enact the middleware to the TracingCompnent itself (traceApplication), so all I’ll be dealing with all the inputs I was wrangling before (Tracer, Propagation p, ActiveSpan) inside that method.
I found more files that I could use for reference, in particular [opentracing-examples/Backend.hs][backend.hs]. After taking some looks at that and some of the other files, I started piecing together everything I knew to get opentracing (from Network.Wai.Middleware.OpenTracing) to work. The code’s not too pretty but here’s the important bit:
    -- TODO: check to ensure that app wide tracing is enabled
    traceApplication t app = if appWideTracingEnabled then instrumentApp app else pure app
        where
          jaegerOptions = tracingSettings t
          appWideTracingEnabled = tracingAppWide $ tracingCfg t
          sampling = probSampler $ tracingSamplingRate $ tracingCfg t
          propagation = jaegerPropagation

          defaultReporter :: FinishedSpan -> IO ()
          defaultReporter = makeLoggerReporter t

          -- Create Standard ENV for Tracer to use, create standard tracer from the env
          mkTracer :: IO (SpanOpts -> IO Span)
          mkTracer = newStdEnv sampling >>= pure . stdTracer

          -- Update Tracer with a JaegerAgentReporter (instead of log based one), produce the middleware
          augmentTracerWithJaeger :: Tracer -> (SpanOpts -> IO Span) -> IO Tracer
          augmentTracerWithJaeger tracer startFn = withJaegerAgent jaegerOptions (\j -> return (tracer { tracerStart=startFn
                                                                                                       , tracerReport=jaegerAgentReporter j
                                                                                                       }))

          -- Use the created tracer to make the middleware
          makeMiddleware :: Application -> Tracer -> IO Application
          makeMiddleware app tracer = pure (opentracing tracer propagation (\activeSpan -> app))

          -- Instrument an actual application with the agent reporter
          instrumentApp :: Application -> IO Application
          instrumentApp app = liftIO (logMsg t INFO "Instrumenting application...")
                              >> mkTracer
                              >>= augmentTracerWithJaeger (Tracer undefined undefined)
                              >>= makeMiddleware app
                              >>= pure
Unfortunately, this code won’t compile: I got stuck on not being able to create Tracer properly. The compiler was becoming confused and couldn’t tell that the Tracer I was making’s m was a valid m, here’s the error it would spit out:
src/Tracing/TracingBackend.hs:91:118-124: error: …
    • Couldn't match type ‘m’ with ‘IO’
      ‘m’ is a rigid type variable bound by
        a type expected by the context:
          forall (m :: * -> *). MonadIO m => SpanOpts -> m Span
        at /path/to/src/Tracing/TracingBackend.hs:91:97
      Expected type: SpanOpts -> m Span
        Actual type: SpanOpts -> IO Span
    • In the ‘tracerStart’ field of a record
      In the first argument of ‘return’, namely
        ‘(tracer
            {tracerStart = startFn, tracerReport = jaegerAgentReporter j})’
      In the expression:
        return
          (tracer
             {tracerStart = startFn, tracerReport = jaegerAgentReporter j})
I thought I just needed to add ScopedTypeVariables, after watching a really good workshop-talk on GADTs that introduced and reading up a bit on it in a good blog post detailing why it’s necessary from schoolofhaskell.com. I knew/thought that this was the problem at all thanks to a really good workshop-talk I recently watched on GADTs. Basically, the problem is that the where clause inside my traceApplication instance function does not know that the m referenced is the same as the outer m in the function defintion, as far as I can tell… I actually filed a ticket becausue of it – I’m not sure how the code could be used if it wouldn’t compile this way.).
With a bunch of help from @kim and some tinkering, I finally got something that compiled:
    traceApplication t app = if appWideTracingEnabled then instrumentApp app else pure app
        where
          jOpts = tracingSettings t
          appWideTracingEnabled = tracingAppWide $ tracingCfg t
          sampling = probSampler $ tracingSamplingRate $ tracingCfg t
          propagation = jaegerPropagation

          defaultReporter :: FinishedSpan -> IO ()
          defaultReporter = makeLoggerReporter t

          -- Create Standard ENV for Tracer to use, create standard tracer from the env
          mkTracer :: MonadIO m => m Tracer
          mkTracer = newStdEnv sampling
                     >>= \env -> liftIO (pure (Tracer (stdTracer env) undefined))

          -- Update Tracer with a JaegerAgentReporter (instead of log based one), produce the middleware
          augmentTracerWithJaeger :: Tracer -> IO Tracer
          augmentTracerWithJaeger tracer = withJaegerAgent jOpts (\j -> return (tracer { tracerReport=jaegerAgentReporter j }))

          -- Use the created tracer to make the middleware
          makeMiddleware :: Application -> Tracer -> IO Application
          makeMiddleware app tracer = pure (opentracing tracer propagation (\activeSpan -> app))

          -- Instrument an actual application with the agent reporter
          instrumentApp :: Application -> IO Application
          instrumentApp app = liftIO (logMsg t INFO "Instrumenting application...")
                              >> mkTracer
                              >>= augmentTracerWithJaeger
                              >>= makeMiddleware app
                              >>= pure
Now that I’m past this, I can actually start testing this monstrosity!
Now that I’ve got a theoretically working TracingBackend, let’s add it to the long list of components that I’m creating @ app startup:
startApp :: AppConfig -> IO ()
startApp c = do
  -- ... other code ...

  -- Set up tracing
  tracingLogger <- buildLogger "App.Tracing" (tracingLogLevel tracingCfg)
  tracingBackend <- makeConnectedTracingBackend tracingCfg (Just tracingLogger)

  -- ... other app setup  ...
  app <- traceApplication tracingBackend app

  logL appLogger WARNING "Application starting up...."
Upon starting the server I get an error, but it’s exactly the error I want (the application attempts to connect to Jaeger):
# lots more output
CacheConfig:
    CACHE_LOG_LEVEL......................... DEBUG
    CACHE_DEFAULT_TIMED_INVALIDATION_MS..... 60000000
MetricsConfig:
    METRICS_LOG_LEVEL....................... DEBUG
    METRICS_INSTRUMENT_APP.................. ["metrics"]
    METRICS_INSTRUMENT_METRICS_ENDPOINT..... True
TracingConfig:
    TRACING_LOG_LEVEL....................... DEBUG
    TRACING_INSTRUMENT_APP.................. "\"job-board\""
    TRACING_SERVICE_NAME.................... []
    TRACING_SERVICE_TAGS.................... 0.0
    TRACING_SAMPLING_RATE................... True
    TRACING_AGENT_UDP_ADDR.................. "127.0.0.1"
    TRACING_AGENT_UDP_PORT.................. 6831
BrandingConfig:
    BRANDING_NAME........................... "job-board-api"
    BRANDING_SUBSCRIBE_URL.................. example.com/email/subscribe
    BRANDING_UNSUBSCRIBE_URL................ example.com/email/unsubscribe
[2018-04-09 11:52:06 JST : App.Backend : INFO] Starting Backend...
[2018-04-09 11:52:06 JST : App.Backend : INFO] DB Currently at version [16], migrating to version [16]
[2018-04-09 11:52:06 JST : App.Search : INFO] Connecting to SQLITE FTS search backend @ (infra/db/local.sqlite)
[2018-04-09 11:52:06 JST : App.Search : INFO] Search successfully migrated
*** Exception: getAddrInfo: does not exist (Name or service not known)
So, the App.Tracing component is failing ot connect to 127.0.0.1:6831, which is expected. I wasn’t 100% sure this was the case, so I beefed up the init code a little bit:
  -- Set up tracing
  tracingLogger <- buildLogger "App.Tracing" (tracingLogLevel tracingCfg)
  tracingBackendOrError <- makeConnectedTracingBackend tracingCfg (Just tracingLogger)
  throwErrorIf (isLeft tracingBackendOrError) ("Failed to initialize Tracing backend: \n" ++ showLeft tracingBackendOrError)
  let (Right tracingBackend) = tracingBackendOrError
I used to do this for every large component, but somewhere along the way I stopped. After doing this, it was easy to see:
[2018-04-09 13:25:10 JST : App.Search : INFO] Connecting to SQLITE FTS search backend @ (infra/db/local.sqlite)
[2018-04-09 13:25:11 JST : App.Search : INFO] Search successfully migrated
*** Exception: Failed to initialize Tracing backend:
getAddrInfo: does not exist (Name or service not known)
CallStack (from HasCallStack):
  error, called at /path/to/src/Util.hs:78:25 in main:Util
Clearly, the tracing backend is reaching out to a Jaeger server but not finding it, which makes sense, since I don’t have a local one running. In development/test environments I probably won’t have one running (for now) so what I’ll do is get one running with docker just so I can do some suuuuuuuper (read suuuuuuuuuuuuuuper) light local testing and consider this feature “done”. This is what laziness sounds like.
Thanks to jaegertracing/all-in-one and the Jaeger getting started documentation it’s pretty easy:
$ docker run -d -e \
  COLLECTOR_ZIPKIN_HTTP_PORT=9411 \
  -p 5775:5775/udp \
  -p 6831:6831/udp \
  -p 6832:6832/udp \
  -p 5778:5778 \
  -p 16686:16686 \
  -p 14268:14268 \
  -p 9411:9411 \
  jaegertracing/all-in-one:latest
I took a bit of time to add a .PHONY Makefile target (called local-jaeger) that does this for me so I don’t have to copy pasta so much. If the previous sentence doesn’t mean anything to you feel free to ignore it, or go do some research on .PHONY targets in Make, they’re super useful for generalizing Make as a build tool.
OK, now that Jaeger is running, I can retry starting my app – hopefully the app starts, and once I visit it I can visit Jaeger’s frontend @ localhost:16686 and get some traces! Here’s what happened when I recompiled and ran the app:
[2018-04-09 14:46:30 JST : App.Metrics : INFO] App-wide Metrics: OFF
[2018-04-09 14:46:30 JST : App.Tracing : INFO] App-wide Tracing: ON
[2018-04-09 14:46:30 JST : App.Tracing : INFO] Setting up tracing WAI middleware...
*** Exception: connect: does not exist (Connection refused)
This error looks really similar to the last one, but there’s a key difference – This exception wasn’t caught by the tracing setup try!. It took me a while to realize it – but I think the stuff TracingBackend was doing actually is completely done, but there’s some forked or asynchronously executed thing that’s failing (which explains why it’s not being caught by the try that’s wrapping TracingBackend’s instrumentApp method. What I think is happening is that some other part of the application is failing – so I added a little more logging to instruentApp:
          -- Instrument an actual application with the agent reporter
          instrumentApp :: Application -> IO Application
          instrumentApp app = liftIO (logMsg t INFO "Setting up tracing WAI middleware...")
                              >> mkTracer
                              >>= augmentTracerWithJaeger
                              >>= makeMiddleware app
                              >>= \updatedApp -> logMsg t INFO "Finished setting up tracing middleware" -- <---- Here it is
                              >> pure updatedApp
And my hypothesis was quickly confirmed – Tracing is theoretically almost ready to go:
[2018-04-09 14:55:24 JST : App.Metrics : INFO] App-wide Metrics: OFF
[2018-04-09 14:55:24 JST : App.Tracing : INFO] App-wide Tracing: ON
[2018-04-09 14:55:24 JST : App.Tracing : INFO] Setting up tracing WAI middleware...
[2018-04-09 14:55:24 JST : App.Tracing : INFO] Finished setting up tracing middleware
*** Exception: connect: does not exist (Connection refused)
So the issue now is either that some code in OpenTracing.* modules is doing something asynchronously that’s causing this failure, or it’s my code that actually has an error in it. Long story short, some ENV variables that were left over from local testing some mail-related features are what was breaking the startup process – totally my fault. Once I straightened out my local .envrc ENV override file and the app started up like a charm.
OK, so everything should be fine at this point, the OpenTracing code has been fitted to the app, and everything starts up correctly with no immediate errors. Unfortunately, it looks like there’s still a problem somewhere, since after spinning up the app and visiting a few endpoints, there was still no new service noted in the Jaeger UI (the only service I could see was jaeger-query, which I believe is Jaeger monitoring itself).
So despite the OpenTracing module related code going correctly as far as I can tell, and the application working as intended, it looks like there’s still a problem, because I set the sampling rate to 1.0 (all the time) and still can’t see any spans in Jaeger that come from my service (named “job-board”).
First place I started was the middleware code inside opentracing-wai/Network/Wai/Middleware/OpenTracing.hs, dropping putStrLns in different parts of the code to figure out if it was being called at all. It was the case that the middleware code was being called, and after some looking around, the next place I looked was Tracer.hs, in particular finishSpan:
finishSpan :: (HasTracer t, MonadIO m) => t -> ActiveSpan -> m FinishedSpan
finishSpan t a = do
    let Tracer{tracerReport} = view tracer t
    span <- liftIO (readActiveSpan a) >>= spanFinish
    case view sampled span of
        Sampled    -> tracerReport span
        NotSampled -> return () -- TODO: record metric
    return span
I’m suspicious that the sampled propery of every span that is coming through is actually being NotSampled. I’m using the Double-based sampling method (which is set to 1.0, I’d expect it to be the same as the constant sampler that’s always true…), I was wondering if it was possible that it is always NotSampled. I wonder if it’s possible that there’s a bug in the code and the random number isn’t being pulled frequently enough or something silly like that. Well either way, I injected a putStrLn so I could find out, and voila:
finishSpan :: (HasTracer t, MonadIO m) => t -> ActiveSpan -> m FinishedSpan
finishSpan t a = do
    let Tracer{tracerReport} = view tracer t
    span <- liftIO (readActiveSpan a) >>= spanFinish

    _ <- liftIO (putStrLn ("Finishing span!"))
    _ <- liftIO (putStrLn ("Sampled?" ++ show (view sampled span)))

    case view sampled span of
        Sampled    -> tracerReport span
        NotSampled -> return () -- TODO: record metric
    return span
Super messy/ugly but it typechecks. Here’s what happens when I run it:
... more output ...
[2018-04-09 23:29:08 JST : App : WARNING] Application starting up....
Finishing span!
Sampled?NotSampled
Finishing span!
Sampled?NotSampled
Finishing span!
Sampled?NotSampled
Finishing span!
Sampled?NotSampled
Well it looks like my guess was right – every time a span is finished, sampling is always resolving to NotSampled. For now I’m going to not use the Double-based sampling method and just have sampling always turned on to get it working. That means changing my code to look like this:
          -- TODO: fix double based probablistic sampler integration
          -- sampling = probSampler $ tracingSamplingRate $ tracingCfg t
          sampling = constSampler True
I’m sure that TODO will get properly fixed someday, what about you? And here’s the resulting output when I run the server and visit a page:
[2018-04-09 23:33:45 JST : App : WARNING] Application starting up....
Finishing span!
Sampled?Sampled
EMITTING!
Jaeger Agent Thrift error: <socket: 18>: hPutBuf: illegal operation (handle is closed)
Finishing span!
Sampled?Sampled
EMITTING!
Jaeger Agent Thrift error: <socket: 18>: hPutBuf: illegal operation (handle is closed)
Finishing span!
Sampled?Sampled
EMITTING!
Jaeger Agent Thrift error: <socket: 18>: hPutBuf: illegal operation (handle is closed)
Finishing span!
Sampled?Sampled
EMITTING!
Jaeger Agent Thrift error: <socket: 18>: hPutBuf: illegal operation (handle is closed)
Partial success! The good news is I can see some putStrLns I set up earlier closer to the emitting code, and it is indeed attempting to emit to the jaeger agent!. Bad news is, of course, that the actual push to the agent over a socket (which happens in OpenTracing.Jaeger.AgentReporter) is failing. I’ve actually run into this sort of problem before, with some email sending code in the MailerBackend which uses the Network.Mail.SMTP module – socket handles seem to close very quickly in my Haskell programs, and I’m not sure why – in the email code the fix I pursued was to make the connection fresh everytime instead of just keeping it around.
Here’s what the code that connects the agent reporter looks like:
openAgentTransport :: Addr 'UDP -> IO AgentTransport
openAgentTransport addr = do
    AddrInfo{..} : _ <- getAddrInfo (Just defaultHints { addrSocketType = Datagram })
                                    (Just . view addrHostName $ addr)
                                    (Just . show . view addrPort $ addr)
    sock <- socket addrFamily addrSocketType addrProtocol
    connect sock addrAddress
    hdl  <- socketToHandle sock ReadWriteMode
    hSetBuffering  hdl NoBuffering -- MUST flush after every message!
    hSetBinaryMode hdl True

    return $ AgentTransport hdl
As far as I can tell, this is only caused once, @ startup (if you’ll remember back, it did fail when I didn’t have local Jaeger running) – the code probably attempts to keep the socket around and re-use it (which is obviously pretty reasonable). I wonder if there’s a good way to solve this that doesn’t involve rewriting the emitting code too much – surely it’s not normal that Haskell just closes sockets and stuff super often… Maybe I am making the same mistake with sockets in different places and just haven’t realized what I’m doing wrong yet.
Since it looks like things aren’t really getting batched up at all (they probably should be?), I’m going to aim for the horribly inefficient approach of just making a new JaegerAgent object every time the Tracer attempts to report. Remember back to when we were setting up Tracer – it basically takes actions to run whenever start and report are supposed to happen – I’m going to make sure that inside that action, a brand new JaegerAgent is made (where as before I would just “augment” and re-use an existing Tracer). Here’s what the new code looks like:
          sendFromNewJaegerAgent :: MonadIO m => FinishedSpan -> m ()
          sendFromNewJaegerAgent finishedSpan  = liftIO (newJaegerAgent jOpts)
                                                 >>= \ja -> jaegerAgentReporter ja finishedSpan

          -- Create Standard ENV for Tracer to use, create standard tracer from the env
          mkTracer :: MonadIO m => m Tracer
          mkTracer = newStdEnv sampling
                     >>= \env -> liftIO (pure (Tracer (stdTracer env) sendFromNewJaegerAgent)) -- <------- I used to leave the second thing as undefined, and update it in a method called `augmentTracerWithJaeger`
While this isn’t a particularly efficient approach, it does work! Here’s the resulting output:
[2018-04-09 23:56:59 JST : App : WARNING] Application starting up....
Finishing span!
Sampled?Sampled
EMITTING!
Finishing span!
Sampled?Sampled
EMITTING!
Finishing span!
Sampled?Sampled
EMITTING!
Finishing span!
Sampled?Sampled
EMITTING!
As you can see, we have all the logging putStrLns from before, but now, we don’t see the hPutBuf errors! I’m taking this to mean that the emitting is actually happening (and not failing). Now there’s no noticable error from the haskell side, but I’m still not seeing my service show up in the Jaeger web console (still see jaeger-query as the only service), so it looks like there’s still yet more debugging to do.
Before I assume it’s completely working, there’s one more way I want to be extra sure that stuff is being sent to Jaeger – let’s set up a echoing netcat socket on that port and see the UDP getting sent – this will probably break my console but oh well. A quick google search yields an ServerFault thread with how to use netcat to echo UDP. The command is:
ncat -e /bin/cat -k -u -l 1235
After shutting down the all-in-one jaeger instance running in docker, I ran the command…. and I see nothing! It looks like allthough the emit code was being hit, it isn’t actually working. Time to dig deeper and find out why…
The first place I thought to return to was the jaegerAgentReporter function (the putStrLn code has been removed):
jaegerAgentReporter :: MonadIO m => JaegerAgent -> FinishedSpan -> m ()
jaegerAgentReporter JaegerAgent{..} s = liftIO $ emit `catchAny` err
  where
    proto = Thrift.CompactProtocol envTransport
    emit  = Thrift.emitBatch (undefined, proto)
          $ toThriftBatch envLocalProcess (Vector.singleton s)
    err e = envErrorLog $ shortByteString "Jaeger Agent Thrift error: "
                       <> string8 (show e)
                       <> char8 '\n'
I wonder if an error is happening, but I just can’t see it? envErrorLog is supposed to handle all of that, and it’s at the top of the file:
data JaegerAgent = JaegerAgent
    { envLocalProcess :: Thrift.Process
    , envErrorLog     :: Builder -> IO ()
    , envTransport    :: AgentTransport
    }
That type signature (Builder -> IO ()) looks familiar to me… Ah, I use it in TracingBackend.hs when I’m setting up the options for the Jaeger Agent:
doLogTextBuilder :: Logger -> Builder -> IO ()
doLogTextBuilder l b = return ()

makeJaegerSettings :: TracingConfig -> Maybe Logger -> JaegerAgentOptions
makeJaegerSettings cfg maybeL = set jaoAddr addr options
    where
      serviceName = tracingServiceName cfg
      options = jaegerAgentOptions serviceName
      host = DT.unpack $ tracingAgentUDPAddr cfg
      port = read $ show $ tracingAgentUDPPort cfg
      addr = UDPAddr host port
      logFn = maybe (\_ -> pure ()) doLogTextBuilder maybeL
Well that’s fun – I make a logging function to report errors, but then never use it! I think I was too scared to do multiple sets with lens since I wasn’t too comfortable with it. One of the great things about the lens library is that they compose, so let’s see if I can get two set functions to easily compose.
makeJaegerSettings :: TracingConfig -> Maybe Logger -> JaegerAgentOptions
makeJaegerSettings cfg maybeL = set jaoAddr addr
                                . set jaoErrorLog logFn
                                $ options
    where
      serviceName = tracingServiceName cfg
      options = jaegerAgentOptions serviceName
      host = DT.unpack $ tracingAgentUDPAddr cfg
      port = read $ show $ tracingAgentUDPPort cfg
      addr = UDPAddr host port
      logFn = maybe (\_ -> pure ()) doLogTextBuilder maybeL
… Well that was easy. I might start getting used to lens after all! Now let’s make that doLogTextBuilder do something with the Logger it’s taking in. Note that the Data.ByteString.Builder is the Builder:
--- ... other imports ...
import qualified Data.ByteString.Lazy.Char8 as BSL8

--- ... other code ...

doLogTextBuilder :: Logger -> Builder -> IO ()
doLogTextBuilder l = logL l ERROR . show . BSL8.unpack . toLazyByteString
Well that was easy… Almost suspiciously so – maybe I’m going to get a bunch of jibberish when I try to log it this way (I am turning a rnadom string of bytes with show & BSL8.unpack…). Fortunately (unfortunately?), when I ran this, I get absolutely nothing out. To be extra sure that I wasn’t just printing jiberish that maybe I couldn’t see, I changed the method a little:
doLogTextBuilder :: Logger -> Builder -> IO ()
doLogTextBuilder l builder = putStrLn "ERROR HAPPENED"
                             >> logL l ERROR (builderToString builder)
    where
      builderToString = show . BSL8.unpack . toLazyByteString
Even after that, nothing… So Either the jaoErrorLog isn’t being called, or an error just isn’t happening… Time to dig even deeper, and double check some assumptions, for example jaegerAgentReporter:
jaegerAgentReporter :: MonadIO m => JaegerAgent -> FinishedSpan -> m ()
jaegerAgentReporter JaegerAgent{..} s = liftIO $ emit `catchAny` err
  where
    proto = Thrift.CompactProtocol envTransport
    emit  = Thrift.emitBatch (undefined, proto)
          $ toThriftBatch envLocalProcess (Vector.singleton s)
    err e = putStrLn ("ERROR OCCURRED" ++ show e)
            -- $ envErrorLog $ shortByteString "Jaeger Agent Thrift error: "
            --            <> string8 (show e)
            --            <> char8 '\n'
After changing that, I still get nothing – an error really isn’t happening, which is great news, but also terrible news, because that is very confusing… Let’s also add a putStrLn to ensure that the Thrift.emitBatch happens…
jaegerAgentReporter :: MonadIO m => JaegerAgent -> FinishedSpan -> m ()
jaegerAgentReporter JaegerAgent{..} s = liftIO $ emit `catchAny` err
  where
    proto = Thrift.CompactProtocol envTransport
    emit  = Thrift.emitBatch (undefined, proto) (toThriftBatch envLocalProcess (Vector.singleton s))
            >> putStrLn "EMITTED THRIFT BATCH!"
    err e = putStrLn ("ERROR OCCURRED" ++ show e)
            -- $ envErrorLog $ shortByteString "Jaeger Agent Thrift error: "
            --            <> string8 (show e)
            --            <> char8 '\n'
Here’s the output when I ran that:
[2018-04-10 00:50:01 JST : App : WARNING] Application starting up....
EMITTED THRIFT BATCH!
EMITTED THRIFT BATCH!
EMITTED THRIFT BATCH!
EMITTED THRIFT BATCH!
Well I’m thoroughly confused. Thrift was emitted, but nothing is actually showed up on the Jaeger side – Maybe the way I tested (that netcat command) must have been wrong – let’s try again. The new command:
netcat -ul 6831
It looks like the command was a problem! something is emitted:
$ ncat -ul 6831
emitBatch
"job-board"
±ڶ*\       api/v1/me
۴\
                                                   peer.address127.0.0.1:5095http.urlhttp://localhost:5001/api/v1/mehttp.status_code200 span.kindSERVER
http.methodGET
It’s horribly formatted probably due to the binary nature, but it looks like thrift data is being sent to Jaeger. Now I’m even more confused – something silly must be going wrong… If I double check the code, it’s using Thrift.CompactProtocol which leads me to believe that 6831 is indeed the right port… And sending works… And I can pretty much see all the fields getting sent and they look roughly correct… But for some reason Jaeger isn’t reflecting what’s being sent to it.
Looks like I’m going to run Jaeger Agent from source. After downloading the code and running it locally, I found that the place packets were being read in from UDP was github.com/jaegertracing/jaeger/cmd/agent/app/servers/thriftudp/transport.go, in a method aptly named Read:
// Read reads one UDP packet and puts it in the specified buf
func (p *TUDPTransport) Read (buf []byte) (int, error) {
Here’s where it gets even more perplexing… Jaeger is indeed getting the messages. If I print the raw buffer:
READ DATA in TUDP transport: [28 28 24 11 34 106 111 98 45 98 111 97 114 100 34 25 12 0 25 28 22 227 198 146 128 175 137 249 164 1 22 214 200 170 178 175 235 188 139 146 1 22 170 139 232 201 220 212 152 224 121 22 0 24 12 97 112 105 47 118 49 47 117 115 101 114 115 25 12 21 2 22 194 163 226 170 161 219 180 5 22 132 12 25 92 24 12 112 101 101 114 46 97 100 100 114 101 115 115 21 0 24 15 49 50 55 46 48 46 48 46 49 58 53 49 57 56 56 0 24 8 104 116 116 112 46 117 114 108 21 0 24 34 104 116 116 112 58 47 47 108 111 99 97 108 104 111 115 116 58 53 48 48 49 47 97 112 105 47 118 49 47 117 115 101 114 115 0 24 16 104 116 116 112 46 115 116 97 116 117 115 95 99 111 100 101 21 0 24 3 50 48 48 0 24 9 115 112 97 110 46 107 105 110 100 21 0 24 6 83 69 82 86 69 82 0 24 11 104 116 116 112 46 109 101 116 104 111 100 21 0 24 3 71 69 84 0 25 12 0 0 0 0 0 0 0 0 0 0 0 0 0 0 0 0 0 0 0 0 0 0 0 0 0 0 0 0 0 0 0 0 0 0 0 0 0 0 0 0 0 0 0 0 0 0 0 0 0 0 0 0 0 0 0 0 0 0 0 0 0 0 0 0 0 0 0 0 0 0 0 0 0 0 0 0 0 0 0 0 0 0 0 0 0 0 0 0 0 0 0 0 0 0 0 0 0 0 0 0 0 0 0 0 0 0 0 0 0 0 0 0 0 0 0 0 0 0 0 0 0 0 0 0 0 0 0 0 0 0 0 0 0 0 0 0 0 0 0 0 0 0 0 0 0 0 0 0 0 0 0 0 0 0 ... more zeros]
The stuff that’s coming back looks like ascii so let’s just convert to a string in golang and see what happens:
READ DATA in TUDP transport:
                             "job-board"
                                                                     įc
                                                                                                               api/v1/users
                                                                                                                                                                     ߟ۴\
                                                                                                                                                                                                                              peer.address127.0.0.1:5203http.url"http://localhost:5001/api/v1/usershttp.status_code200       span.kindSERVER
                                                                                                                                                                                                                                                                                                                                                                                                     http.methodGET
Welp, that’s exactly what I expected – the problem is officially not on the haskell side (unless of course this message is malformed)… Time to trace this message through the agent plumbing and see if there’s some issue (no errors are being reported) that isn’t obvious. The golang code also doesn’t return an error from Read, error is properly nil. The next stop on our adventure looks to be agent.go (github.com/jaegertracing/jaeger/thrift-gen/agent/agent.go), since it seems to be doing some reading we picked up on.
After looking at thrift-gen/agent/agent.go and dropping some fmt.Printlns all over the place, I realize that it’s not the right file to be trying, github.com/jaegertracing/jaeger/thrift-gen/jaeger/agent.go is what I want:
func (p *AgentProcessor) Process(iprot, oprot thrift.TProtocol) (success bool, err thrift.TException) {
    name, _, seqId, err := iprot.ReadMessageBegin()
    if err != nil {
        return false, err
    }
    if processor, ok := p.GetProcessorFunction(name); ok {
        fmt.Println("Dispatching processor function ", name)
        return processor.Process(seqId, iprot, oprot)
    }
    iprot.Skip(thrift.STRUCT)
    iprot.ReadMessageEnd()
    x7 := thrift.NewTApplicationException(thrift.UNKNOWN_METHOD, "Unknown function "+name)
    oprot.WriteMessageBegin(name, thrift.EXCEPTION, seqId)
    x7.Write(oprot)
    oprot.WriteMessageEnd()
    oprot.Flush()
    return false, x7

}

func (p *agentProcessorEmitBatch) Process(seqId int32, iprot, oprot thrift.TProtocol) (success bool, err thrift.TException) {
    args := AgentEmitBatchArgs{}
    fmt.Println("Processing?")
    if err = args.Read(iprot); err != nil {
        fmt.Println("ERROR OCCURRED?", err) // <----- This line triggers :(
        iprot.ReadMessageEnd()
        return false, err
    }

    fmt.Println("MESSAGE END?")
    iprot.ReadMessageEnd()
    var err2 error
    if err2 = p.handler.EmitBatch(args.Batch); err2 != nil {
    fmt.Println("EMITTING BATCH FAILED??")
        return true, err2
    }
    fmt.Println("ALL GUD?")
    return true, nil
}
As is written in the code there, there is an error running Process on the data. Note that there is actually more than one Process function in that file, as there is a dispatch that happens from a more general Process function. Here’s what it looks like with my print-based debugging:
Dispatching processor function  emitBatch
Processing?
ERROR OCCURRED? *jaeger.AgentEmitBatchArgs field 0 read error: EOF
This makes sense – emitBatch is indeed what we’ve been seeing go out over UDP, but it looks like the Jaeger Agent can’t read it – it seems to fail on the very first field, with an EOF. Unfortunately, none of this is logged out to the user (maybe it’s just not expected?), but I would expect that this would get logged to stderr or at the very least debug output. At this point I can think of at least two issues to file – one against jaegertracing/jaeger to start doing some debug/error output on this, and one to kim/opentracing to let them know that Jaeger doesn’t seem to actually be able to take their output.
I’ve filed a ticket with kim/opentracing, and what I’ll do is switch to using the Zipkin-based reporters/code instead of using the Jaeger compact-thrift-based reporters/code, as it might be the case that the Jaeger based code just doesn’t work yet. Luckily, kim/opentracing is pretty robust, and has a variety of different methods to send the information – Jaeger is also robust in that it accepts Zipkin-formatted data, so that means I should be able to just use both of these pieces of code in zipkin-mode (so to speak) and end up with a working solution.
Since I’ve had some problems that seem to be pretty deep with the Thrift-based UDP jaeger reporter, I’m going to go ahead and try sending with Zipkin’s protocol (sent over HTTP) instead and see how that works. I should be able to leave all the code I have in place (for someday, when the my code/the jaeger code isn’t broken) and just extend the TracingSettings type and relevant setup code in TracingBackend to accomodate multiple types of tracer backends. The reason I build these components this way, and went through the trouble of abstracting TracingSettings is for exactly this purpose, so it looks like I’ll get to test it out sooner rather than later.
Since this post is already quite long, I wont go into the debugging I needed to do getting the zipkin code to work but, but I will mention that I ran into a problem with the newZipkin code it errors with Prelude.read despite there not being an explicit read operation any where in sight. Weirdly enough, you also can’t even do putStrLn debugging on the function itself unless you remove the pattern match in the function definition (the opts@... part). I thought it might be my fault, maybe I was giving it a bad log function somehow, but the problem happened (failure with Prelude.read no parse error) regardless of if I specified an error log function or not. Weirdly enough, once I removed the pattern match I could use putStrLn to figure out where the code was going and quickly found that parseRequest (from Network.HTTP.Client) was the culprit. The URL that was being generated was malformed/not parsing correctly.
Want to see some really ugly but effective debugging code?
newZipkin :: ZipkinOptions -> IO Zipkin
newZipkin opts = do
    _ <- putStrLn "BEFORE MAKING REQUEST"
    rq <- mkReq
    putStrLn ("Request:" ++ show rq)
    fmap Zipkin
        . newBatchEnv
        . batchOptions
        $ reporter opts rq
  where
    mkReq = do
        _ <- putStrLn "BEFORE PARSE REQUEST"
        _ <- putStrLn ("INTENDED HOST [" ++ view (zoAddr . addrHostName) opts ++ "]")
        _ <- putStrLn ("INTENDED PORT [" ++ show (view (zoAddr . addrPort) opts) ++ "]")
        rq <- parseRequest rqBase
        _ <- putStrLn "AFTER PARSE REQUEST"
        return rq
            { requestHeaders = [(hContentType, "application/json")]
            , secure         = view (zoAddr . addrSecure) opts
            }

    rqBase =
           "POST http://"
        <> view (zoAddr . addrHostName) opts
        <> ":"
        <> show (view (zoAddr . addrPort) opts)
        <> "/api/v2/spans"
I spent like 10 minutes looking at documentation on debugging haskell and options for the GHCI debugger and immediately quit right there and then. none of the approaches were dead easy and just looked like I’d have to spend a few hours trying to feel my way around so I stuck with putStrLn debugging. Advanced debugging (outside of javascript) might be one of my biggest weaknesses. Anyway back to the task at hand – here’s what that printed out:
[2018-04-11 20:59:54 JST : App.Tracing : DEBUG] Creating fresh Zipkin instance, updating IORef
BEFORE MAKING REQUEST
BEFORE PARSE REQUEST
INTENDED HOST [[2018-04-11 20:59:54 JST : App.Mailer : INFO]
----------------Sending email----------------
From: <>
To: <>
Subject: App - ERROR
MIME-Version: 1.0
Content-Type: multipart/alternative; boundary="IJ8ajEE8zA"

--IJ8ajEE8zA
Content-Type: text/plain; charset=utf-8
Content-Transfer-Encoding: quoted-printable

Log record:
[2018-04-11 20:59:54 JST : App : ERROR] Prelude=2Eread: no parse
--IJ8ajEE8zA
Content-Type: text/html; charset=utf-8
Content-Transfer-Encoding: quoted-printable

Log record:
[2018-04-11 20:59:54 JST : App : ERROR] Prelude=2Eread: no parse
--IJ8ajEE8zA--
---------------------------------------------

[2018-04-11 20:59:54 JST : App : ERROR] Prelude.read: no parse
Prelude.read: no parse
In this bit you can see that I actually send myself emails when errors happen, and send myself the log. In development mode, the email “sending” just prints to the log, so that’s what you see here. As you can see, there’s a super non-descript Prelude.read: no parse error in all it’s stack-trace-less glory. The important bit is that “INTENDED HOST [” starts to get printed out, but then stops – this is was where the first inkling that the problem is with the address. Of course, if I replace the second half of the line with just a regular string (++ "regular string" ++), the line prints out just fine, like this:
  where
    mkReq = do
        _ <- putStrLn "BEFORE PARSE REQUEST"
        _ <- putStrLn ("INTENDED HOST [" ++ "TEST" ++ "]")
        _ <- putStrLn ("INTENDED HOST [" ++ view (zoAddr . addrHostName) opts ++ "]")
        _ <- putStrLn ("INTENDED PORT [" ++ show (view (zoAddr . addrPort) opts) ++ "]")
        rq <- parseRequest rqBase
Want to know something else? BOTH lines are actually broken. both the host and port lines that are being used don’t work, yet somehow compiled. opts is supposed to be a ZipkinOptions object, and I’m fairly sure that function chaining order is incorrect, given that the structure for ZipkinOptions looks like this:
data ZipkinOptions = ZipkinOptions
    { _zoManager       :: Manager
    , _zoLocalEndpoint :: Endpoint
    , _zoAddr          :: Addr 'HTTP
    , _zoLogfmt        :: forall t. Foldable t => t LogField -> Builder -- == LogFieldsFormatter
    , _zoErrorLog      :: Builder -> IO ()
    }
Common sense would tell me that the zoAddr should be the first function executed but maybe the combination order is left to right with lenses… Either way I don’t care enough to deep dive lens right now/get more properly educated, I just care enough to get the code to work (we’ll worry about axiomatic use later), so the first thing I’m going to do is hardcode and see where we get. I hardcoded in the values to make the URL (remember, I vendored this library since it’s still unreleased, so it’s pretty easy to modify it). That means rqBase looks like:
    rqBase =
           "POST http://"
        <> "127.0.0.1" -- view (zoAddr . addrHostName) opts
        <> ":"
        <> "9411" -- show (view (zoAddr . addrPort) opts)
        <> "/api/v2/spans"
After hardcoding those bits, I can properly get past the putStrLns I would expect! Check out this output:
[2018-04-11 21:16:00 JST : App.Tracing : DEBUG] Creating fresh Zipkin instance, updating IORef
BEFORE MAKING REQUEST
BEFORE PARSE REQUEST
INTENDED HOST [TEST]
AFTER PARSE REQUEST
Request:Request {
  host                 = "127.0.0.1"
  port                 = 9411
  secure               = False
  requestHeaders       = [("Content-Type","application/json")]
  path                 = "/api/v2/spans"
  queryString          = ""
  method               = "POST"
  proxy                = Nothing
  rawBody              = False
  redirectCount        = 10
  responseTimeout      = ResponseTimeoutDefault
  requestVersion       = HTTP/1.1
}
Awesome, so after hardcoding the strings to what their values would be now we’re flying through the request parsing phase. It’s not shown in the logs above but there’s another Prelude.read error so we’re not home free yet, but just to get things working for the blog post, I’ll hardcode and see if we can get a trace showing (then go back and properly fix the code and probably file a ticket on Github). After a few more minutes of hardcoding, I got past everything in that one function, only to realize that the Prelude.read errors were elsewhere as well – obviously after making the request the next thing to do was to convert the FinishedSpan into something we could send to Zipkin…
spanE :: Endpoint -> LogFieldsFormatter -> FinishedSpan -> Encoding
spanE loc logfmt s = pairs $
       pair "name"           (view (spanOperation . to text) s)
    <> pair "id"             (view (spanContext . to ctxSpanID  . hexText . to text) s)
    <> pair "traceId"        (view (spanContext . to ctxTraceID . hexText . to text) s)
    <> maybe mempty
            (pair "parentId" . text . view hexText)
            (view (spanContext . to ctxParentSpanID) s)
    <> maybe mempty
            (pair "kind" . toEncoding)
            (view (spanTags . to (getTag SpanKindKey)) s)
    <> pair "timestamp"      (view (spanStart . to microsE) s)
    <> pair "duration"       (view (spanDuration . to microsE) s)
    <> pair "debug"          (bool False)
    <> pair "localEndpoint"  (toEncoding loc)
    <> maybe mempty
             (pair "remoteEndpoint")
             (view (spanTags . to remoteEndpoint) s)
    <> pair "annotations"    (list (logRecE logfmt) $ view spanLogs s)
    <> pair "tags"           (toEncoding $ view spanTags s)
    -- nb. references are lost, perhaps we should stick them into annotations?
No idea which one of these is causing the next Prelude.read error, but after about 30 minutes of trying to mess with it, I’m going to give it a rest. This library just doesn’t seem to be ready for primetime (which is fine, no one said it was, it’s literally unreleased code that hasn’t been worked on in a few months), but I think I’m just going to try out servant-tracing instead.
:( sad that I had to give up, but I guess this is what happens. I think I learned a few things though, and definitely read some code in the process, so I’m at least happy about that.
Well the good news is now I can remove all the vendored code, assuming v0.1.0.0 of servant-tracing was functional (considering there’s a big notice that it’s the “bare minimum”, I’m pretty hopeful). I’ll also have to rip out all the code that did anything except zipkin, since that’s all I’ll be able to use for now (and I don’t want to leave the code for other backends around if I’m not going to use them anytime soon).
Here’s a bit of a new hypothesis – I’m going to use the publishZipkin code from servant-tracing which looks wonderfully simple, totally ignore the ServantTracingT monad transformer, and see if I can’t write a really quick WAI Middleware to use in the already-written instrumentApplication method!
Since this post is getting ridiculously long, I’m going to cut out the “try” and just post the “did”. If you read all this way through the ups and downs, you ought to be congratulated. I will say however, that working with servant-tracing was pretty easy after all the work I did trying to understand kim/opentracing (maybe also because servant-tracing is just inherently less robust/simpler) – in <30 mins everything typechecked (even with a reasonable amount of polymorphism left in), and all that was left was to write the WAI middleware.
After sleeping a night and waking up, I was done with the whole implementation and it was working in <1hr (albeit less robustly). I also found what I think might be a bug in servant-tracing and filed an issue (containing how I “fixed” it).
The actual code below (in the TLDR section) is what actually works – using servant-tracing and a WAI middleware to enable rudimentry tracing for a WAI application.
It’s been quite a ride working through getting this library working, but hopefully it’s been helpful at the very least as a peek into the mind of an new/intermediate haskeller’s path through figuring out a new library. Here’s all the code that made it happen:
TracingBackend.hs:
{-# LANGUAGE OverloadedStrings        #-}
{-# LANGUAGE RankNTypes               #-}
{-# LANGUAGE ConstrainedClassMethods  #-}

module Tracing.TracingBackend ( makeConnectedTracingBackend
                              , TracingBackend
                              , Tracing(..)
                              ) where

import           Config (TracingConfig(..), TracingBackendType(..))
import           Control.Exception (SomeException, try, bracket)
import           Control.Monad (void)
import           Control.Monad.IO.Class
import           Data.ByteString.Builder
import           Data.IORef (IORef, newIORef, readIORef,  atomicModifyIORef')
import           Data.Maybe (Maybe, fromMaybe)
import           Data.Monoid ((<>))
import           Data.Time.Clock (NominalDiffTime, UTCTime, getCurrentTime, diffUTCTime)
import           Data.Time.Clock.POSIX (POSIXTime, utcTimeToPOSIXSeconds, posixSecondsToUTCTime)
import           Network.HTTP.Client (Manager, newManager, defaultManagerSettings)
import           Network.Wai (Application, Middleware, Request, requestMethod, pathInfo)
import           System.Log.Logger (Logger, Priority(..), logL)
import           System.Random (randomRIO)
import           Tracing.Core (Span(..), OpName(..), SpanContext(..), SpanId(..), TraceId(..))
import           Tracing.Zipkin (publishZipkin)
import           Types (HasLogger(..))
import qualified Data.ByteString.Lazy.Char8 as BSL8
import qualified Data.Text as DT

data TracingBackend = TracingBackend { tbCfg    :: TracingConfig
                                     , tbLogger :: Maybe Logger
                                     , tbSpans  :: IORef [Span]
                                     , tbMgr    :: Maybe Manager
                                     }

makeConnectedTracingBackend :: TracingConfig -> Maybe Logger -> IO (Either SomeException TracingBackend)
makeConnectedTracingBackend cfg maybeL = try makeBackend
    where
      makeManager = case tracingBackendType cfg of
                      Local -> pure Nothing
                      Zipkin -> Just <$> newManager defaultManagerSettings
      makeBackend = newIORef []
                    >>= \spans -> makeManager
                    >>= pure . TracingBackend cfg maybeL spans

-- ^ Create a reporter, polymorphic by the settings that are currently in the Tracing t
getPublisher :: (MonadIO m, Tracing t, HasLogger t) => t -> [Span] -> m ()
getPublisher t = case tracingBackendType cfg of
                   Local -> logPublisher t
                   Zipkin -> zipkinPublisher t
    where
      cfg = getTracingConfig t

-- ^ Publishes one or more spans to the local log
logPublisher :: (MonadIO m, HasLogger t) => t -> [Span] -> m ()
logPublisher tracer = liftIO . mapM_ (logMsg tracer INFO . show)

-- ^ Publishes one or more spans a zipkin instance
-- this method *assumes* that zipkin agents (`Zipkin`s) don't need to be re-created every time, and can be reused, so stores them
zipkinPublisher :: (HasLogger t, Tracing t, MonadIO m) => t -> [Span] -> m ()
zipkinPublisher t spans = liftIO (maybe logNoMgrErr doPublish maybeMgr)
    where
      cfg = getTracingConfig t
      maybeMgr = getTracingManager t
      host = DT.unpack $ tracingAgentHTTPAddr cfg
      port = show $ tracingAgentHTTPPort cfg
      addr = "http://" <> host <> ":"<> port <> "/api/v2/spans"
      logNoMgrErr = logMsg t ERROR "No HTTP Manager configured for Zipkin tracing backend"
      debugLogResponse = logMsg t DEBUG . ("Zipkin Resp: "<>) . show
      doPublish mgr = publishZipkin addr mgr spans
                      >>= debugLogResponse
                      >> pure ()

-- ^ Create a WAI-compatible middleware that will trace every request
makeTracingMiddleware :: (Tracing t, HasLogger t) => t -> Middleware
makeTracingMiddleware t app req respond = bracket
                                          (startRequestSpan t req)
                                          (\reqSpan -> finishRequestSpan t reqSpan >> publishSpans t)
                                          (\_ -> app req respond)

-- ^ Reduce the precision of the NominalDiffTime objects that are being sent
-- this is necessary because the following error gets sent from Jaeger (when sending a NominalDiffTime of "0.001500525s" ):
-- "Unable to process request body: json: cannot unmarshal number 1500.525 into Go struct field Span.duration of type int64\n"
-- (running regular zipkin will just produce a "failed to parse" error with no details)
reducePrecision :: (Num a, RealFrac a) => Int -> a -> a
reducePrecision places = (/ factor) . fromInteger . round . (* factor)
    where
      factor = 10 ^ places

class Tracing t where
    getTracingLogger  :: t -> Maybe Logger
    getTracingConfig  :: t -> TracingConfig
    getTracingManager :: t -> Maybe Manager
    getPublisherFn    :: (MonadIO m, Tracing t, HasLogger t) => t -> [Span] -> m ()

    -- ^ Take a single WAI Request and generate a span for it
    startRequestSpan :: t -> Request -> IO Span

    -- ^ Save a single generated span onto an internal list of spans
    finishRequestSpan :: t -> Span -> IO ()

    -- ^ Publish all recorded spans (in the internal list)
    publishSpans :: t -> IO [Span]

    -- ^ Add a single span to the internal buffer
    addSpan :: t -> Span -> IO ()

    -- ^ Remove spans (that have been recorded) from the internal buffer
    removeSpans :: t -> [Span] -> IO ()

    -- ^ Trace an application at the request level
    traceApplication :: t -> Application -> IO Application

instance HasLogger TracingBackend where
    getComponentLogger = tbLogger

instance Tracing TracingBackend where
    getTracingLogger = tbLogger
    getTracingConfig = tbCfg
    getTracingManager = tbMgr
    getPublisherFn = getPublisher

    startRequestSpan t req = getCurrentTime
                             >>= \now -> generateTraceId
                             >>= \traceId -> generateSpanId
                             >>= \spanId -> pure Span { serviceName=svcName
                                                      , operationName=OpName reqURL
                                                      , context=SpanContext traceId spanId
                                                      , timestamp=utcTimeToPOSIXSeconds now
                                                      , duration=0
                                                      , relations=[]
                                                      -- TODO: tag with request method
                                                      , tags=mempty
                                                      , baggage=mempty
                                                      , debug=False
                                                      }
        where
          cfg = getTracingConfig t
          svcName = tracingServiceName cfg
          reqURL = DT.intercalate "/" $ pathInfo req
          tags = [requestMethod req]
          generateSpanId  = SpanId <$> randomRIO (0, maxBound)
          generateTraceId = TraceId <$> randomRIO (0, maxBound)
    -- TODO: add sample-checking code to honor double from 0.0 to 1.0

    finishRequestSpan t span = getCurrentTime
                               >>= \now -> pure (span { duration=reducePrecision 6 (diffUTCTime now timestampUTC) })
                               >>= \finishedSpan -> logMsg t DEBUG ("Finishing request span (" <> opName <> "), duration = " <> show (duration finishedSpan))
                               >> addSpan t finishedSpan
        where
          timestampUTC = posixSecondsToUTCTime $ timestamp span
          opName = show (operationName span)

    publishSpans t = readIORef (tbSpans t)
                     >>= \spans -> logMsg t DEBUG ("Publishing " <> show (length spans) <> " saved spans...")
                     >> doPublish spans
                     -- atomically remove spans that have bene published
                     >> removeSpans t spans
                     >> pure spans
        where
          doPublish = getPublisherFn t

    addSpan t newSpan = atomicModifyIORef' (tbSpans t) (\l -> (l <> [newSpan], ()))

    removeSpans t spansToRemove = atomicModifyIORef' (tbSpans t) filterSpans
        where
          extractSpanId = spanId . context
          spanIdsToRemove = map extractSpanId spansToRemove
          removeMatchingSpans = filter ((`notElem` spanIdsToRemove) . extractSpanId)
          filterSpans currentSpans = (removeMatchingSpans currentSpans, ())

    traceApplication t app = logMsg t INFO ("App-wide Tracing: " <> if appWideTracingEnabled then "ON" else "OFF")
                             >> if appWideTracingEnabled then _traceApplication app else pure app
        where
          appWideTracingEnabled = tracingAppWide $ tbCfg t
          middleware = makeTracingMiddleware t

          -- Instrument an actual application with the agent reporter
          _traceApplication :: Application -> IO Application
          _traceApplication app = liftIO (logMsg t INFO "Setting up tracing WAI middleware...")
                                  >> pure (middleware app)
This is pretty highly specific to the way my application is set up (the typeclasses and what not), but hopefully you can pull useful things from it. There’s also some stuff yet to be done (TODOs all over), but they’re relatively minor so I’ll work on them later.
As you can see, I’ve opted to NOT use a bunch of the facilities offered by servant-tracing (MonadTracer, ServantTracingT, WithTracing), basically shoddily rebuilding them in my own application (once you look at the implementations, they’re quite similar) – however I don’t think I’ve added too much incidental complexity so I’m not too sad about it. In the future I plan to look into how easily I can just add ServantTracingT to my monad stack, or if I can just make my StateT ApplicationGlobals m an instance of MonadTracer (in that case, the TracingBackend would do not much more than holding the Tracer that servant-tracing uses.
For now, I’m going to just rest with a working (althrough horribly inefficient, it sends the trace every time, wraps every single call, etc) implementation. Here’s a snapshot of Jaeger showing the trace:
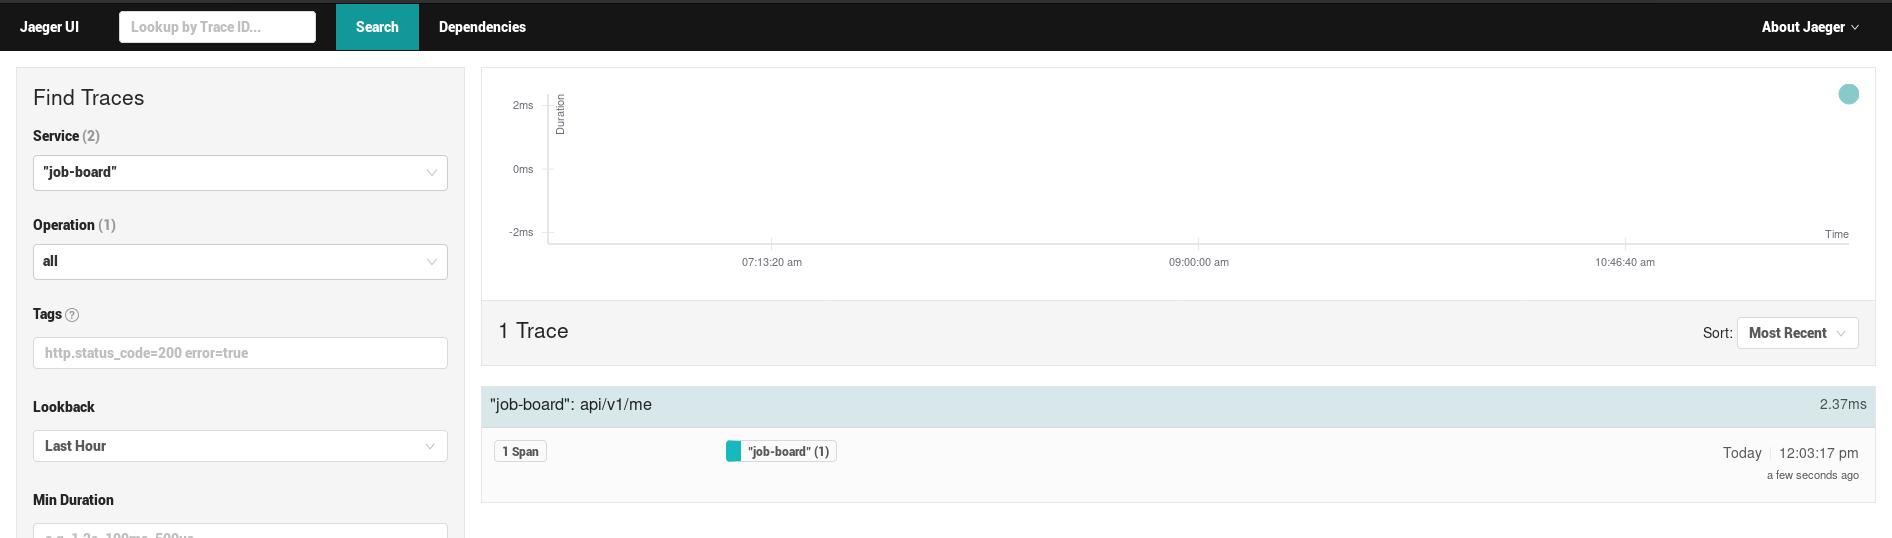 (very
(very 2ms, so fast! wow)
Here’s the 1000ft view of what’s happening (and a little bit about my application structure):
startApp :: AppConfig -> IO () gets runstartApp, a TracingConfig is pulled from the AppConfigTracingConfig, a “connected” TracingBackend is built.instrumentApp :: Application -> IO Application method from the Tracing typeclass (which TracingBackend offers) takes a WAI application, uses a mix of my code and servant-tracing’s to wrap an application in middleware that traces every call.instrumentApp to be used in startApp (when the WAI application actually gets started)This has been a pretty long and crazy ride. This is one of the longer posts I’ve done, and it took place over a multiple days, maybe a full week all together of working on it on and off. I’m glad I finally got it working, but man it was more work than I thought it was going to be.
It is nice to finally have some nice tracing data (that I don’t need quite yet), and a decent way to visualize app performance. This project also gave me a good reason/chance to [read the OpenTracing spec][opentracing-spec] which is actually pretty simple, and a good chance to get a tiny bit of hands on experience with Jaeger. Hope you enjoyed reading about it as much as I enjoyed writing it!
If I think about this entire process really pessimistically, it’s taken me multiple days just to set up one WAI middleware so I can send 1 HTTP request to another service when and endpoint is hit. That’s abysmal productivity-wise. Let’s not think about this pessimistically – gotta stay on the happy path.
Haskell’s lack of mature libraries to do this stuff is disappointing, but it’s nothing that writing some code can’t fix :). There are also people well on their way to complete/working implementations and that’s really encouraging. Maybe I should have just used servant-tracing from the start, despite the reduced feature set that initially turned me off. I think I learned a lot working with kim/opentracing since the architecture is pretty sound and reusable, and it was a great chance to read some Haskell code I didn’t write and see concepts in the wild. In the end I’m pretty happy that I got something working and look forward to working with this in the future.