DDG search drop in powered by ddg.patdryburgh.com
tl;dr - I did some maintenance and upgrades to packages on my small k8s cluster – I added NodeLocal DNSCache (which prompted an upgrade to prometheus and node_exporter along the way). I also upgraded kube-router (v1.0.1 -> v1.2.0), jaeger (1.3.0 -> v1.22.0), cert-manager (v0.16.1 -> v1.2.0), traefik (v2.3.2 -> v2.4.8) and containerd (v.2.7 -> v1.4.4).
Welcome to the first (and possibly last) installment of Upgrade Sunday – a series of posts where I share some notes on difficulties/process encountered while working on some maintenance and/or updates to my small Kubernetes cluster. It’s highly unlikely that it’ll always happen on sundays but that seems like a nice day to start.
As I try to stay abreast of the changes in Kubernetes and DevOps as a whole (normally while thinking up ways I could run projects more efficiently), I often run into things that I want to try/big updates that have happened and generally take a note to perform them on my cluster eventually – this post should serve as a recording of one of those rare times that “eventually” actually came.
I first heard about NodeLocal DNSCache from thanks to an excellent talk – “Going from 5s to 5ms: Benefits of a Node-Local DNSCache” by Pavithra Ramesh & Blake Barnett given at KubeCon/CloudNativeCon 2019. We’re in 2021 so why is the talk so old? Well that’s just how deep my “Watch Later” list is. There is an insane amount of educational value locked up in YouTube especially for tech and I love picking through conferences (ex. FOSDEM 2021 though they host their own vids which is awesome) and watching talks on technology I’m interested in. Anyway, you can learn everything you need to know about Node Local DNS in the Kubernetes docs.
The problem of node-local DNS is well documented at the official documentation for node-local-dns. Caching local DNS queries is one thing but obviously this is going to have the biggest benefit for my local Container Networking Interface (CNI) (and the Kubernetes CNI plugin docs) plugin – kube-router. Theoretically kube-router should be able to route things much more quickly if DNS resolves quicker. The way kube-router works also used to be different from how kube-proxy worked (kube-proxy has since changed), as it uses IPVS so I think I should see a benefit there (as node-local-dns is targeted towards kube-proxy) I’m a bit shaky on this but will carry on regardless.
node_exporterBefore we get started upgrading the DNS situation, it’s probably a good idea to revisit my per-node prometheus setup and upgrade that as well for monitoring later. I have a small cluster-wide prometheus instance running in the monitoring namespace, so might as well update that while I’m here, along with the node_exporter that is sending node metrics. There are lots of good stats that I can look into later once this is installed, which would help measure the DNS and/or IPVS performance:
node_exporter is pretty impressive – it’s got just about anything you could want, but while we’re here let’s upgrade prometheus while we’re here. Prometheus is generally rock-solid and a pretty simple piece of software so I expect to be able to jump quite a few versions without breaking a sweat. Taking a look at the version I last deployed, it’s version v2.9.2 (released 2019-04-24), and the newest is v2.25.2 (released 2021-03-16). I think I’ll be able to jump all the way to the end version, but let’s read through the Prometheus release note stream and see if anything pops out to me as a risk first, and include any changelogs I think were interesting:
ConfigMap I’m using127.0.0.1 versus localhost veersus http://localhost or whatever else could be pretty annoyingWow, not a single one of these changes looks like it could brick me! The change should be as easy as just changing the version in the DaemonSet spec. Let’s take a quick look at the logs:
$ k logs -f prometheus-fvp22 -n monitoring
level=info ts=2021-03-21T05:00:01.457Z caller=head.go:540 component=tsdb msg="head GC completed" duration=3.122452ms
level=info ts=2021-03-21T07:00:01.427Z caller=compact.go:499 component=tsdb msg="write block" mint=1616299200000 maxt=1616306400000 ulid=01F19SAQCA13Z77JYQ4Q7YKHTY duration=392.57877ms
level=info ts=2021-03-21T07:00:01.502Z caller=head.go:540 component=tsdb msg="head GC completed" duration=3.172676ms
level=info ts=2021-03-21T09:00:01.401Z caller=compact.go:499 component=tsdb msg="write block" mint=1616306400000 maxt=1616313600000 ulid=01F1A06EM6A8QDTM1Y9P8400H0 duration=371.062726ms
level=info ts=2021-03-21T09:00:01.483Z caller=head.go:540 component=tsdb msg="head GC completed" duration=3.234698ms
level=info ts=2021-03-21T09:00:01.803Z caller=compact.go:444 component=tsdb msg="compact blocks" count=3 mint=1616284800000 maxt=1616306400000 ulid=01F1A06F2HCFR2CDVN6P4KN0BQ sources="[01F19BK8WARYQAW8NJ6BT4P1TG 01F19JF04B89WV6EFGJETF3ENQ 01F19SAQCA13Z77JYQ4Q7YKHTY]" duration=313.668747ms
level=info ts=2021-03-21T09:00:02.324Z caller=compact.go:444 component=tsdb msg="compact blocks" count=3 mint=1616241600000 maxt=1616306400000 ulid=01F1A06FEB071CCQCSV74KKJ4Y sources="[01F18Q03J7HP4G9GFD94652P4A 01F19BK990EDBEJZ1E26H7YAHR 01F1A06F2HCFR2CDVN6P4KN0BQ]" duration=456.45621ms
OK tons of gibberish but nothing looks wrong… After changing image: prom/prometheus:v2.9.2 to image: prom/prometheus:v2.25.2, here are the logs:
$ k logs -f prometheus-k4njx -n monitoring
level=info ts=2021-03-21T11:07:12.568Z caller=main.go:366 msg="No time or size retention was set so using the default time retention" duration=15d
level=info ts=2021-03-21T11:07:12.568Z caller=main.go:404 msg="Starting Prometheus" version="(version=2.25.2, branch=HEAD, revision=bda05a23ada314a0b9806a362da39b7a1a4e04c3)"
level=info ts=2021-03-21T11:07:12.569Z caller=main.go:409 build_context="(go=go1.15.10, user=root@de38ec01ef10, date=20210316-18:07:52)"
level=info ts=2021-03-21T11:07:12.569Z caller=main.go:410 host_details="(Linux 4.18.0-25-generic #26-Ubuntu SMP Mon Jun 24 09:32:08 UTC 2019 x86_64 prometheus-k4njx (none))"
level=info ts=2021-03-21T11:07:12.569Z caller=main.go:411 fd_limits="(soft=1048576, hard=1048576)"
level=info ts=2021-03-21T11:07:12.569Z caller=main.go:412 vm_limits="(soft=unlimited, hard=unlimited)"
level=info ts=2021-03-21T11:07:12.571Z caller=web.go:532 component=web msg="Start listening for connections" address=0.0.0.0:9090
level=info ts=2021-03-21T11:07:12.572Z caller=main.go:779 msg="Starting TSDB ..."
level=info ts=2021-03-21T11:07:12.574Z caller=tls_config.go:191 component=web msg="TLS is disabled." http2=false
level=info ts=2021-03-21T11:07:12.576Z caller=head.go:668 component=tsdb msg="Replaying on-disk memory mappable chunks if any"
level=info ts=2021-03-21T11:07:12.576Z caller=head.go:682 component=tsdb msg="On-disk memory mappable chunks replay completed" duration=2.513µs
level=info ts=2021-03-21T11:07:12.576Z caller=head.go:688 component=tsdb msg="Replaying WAL, this may take a while"
level=info ts=2021-03-21T11:07:12.576Z caller=head.go:740 component=tsdb msg="WAL segment loaded" segment=0 maxSegment=0
level=info ts=2021-03-21T11:07:12.576Z caller=head.go:745 component=tsdb msg="WAL replay completed" checkpoint_replay_duration=34.222µs wal_replay_duration=237.946µs total_replay_duration=291.961µs
level=info ts=2021-03-21T11:07:12.578Z caller=main.go:799 fs_type=EXT4_SUPER_MAGIC
level=info ts=2021-03-21T11:07:12.578Z caller=main.go:802 msg="TSDB started"
level=info ts=2021-03-21T11:07:12.578Z caller=main.go:928 msg="Loading configuration file" filename=/etc/prometheus/prometheus.yml
level=info ts=2021-03-21T11:07:12.578Z caller=main.go:959 msg="Completed loading of configuration file" filename=/etc/prometheus/prometheus.yml totalDuration=750.89µs remote_storage=2.078µs web_handler=406ns query_engine=897ns scrape=318.772µs scrape_sd=54.114µs notify=963ns notify_sd=2.683µs rules=1.556µs
level=info ts=2021-03-21T11:07:12.578Z caller=main.go:751 msg="Server is ready to receive web requests."
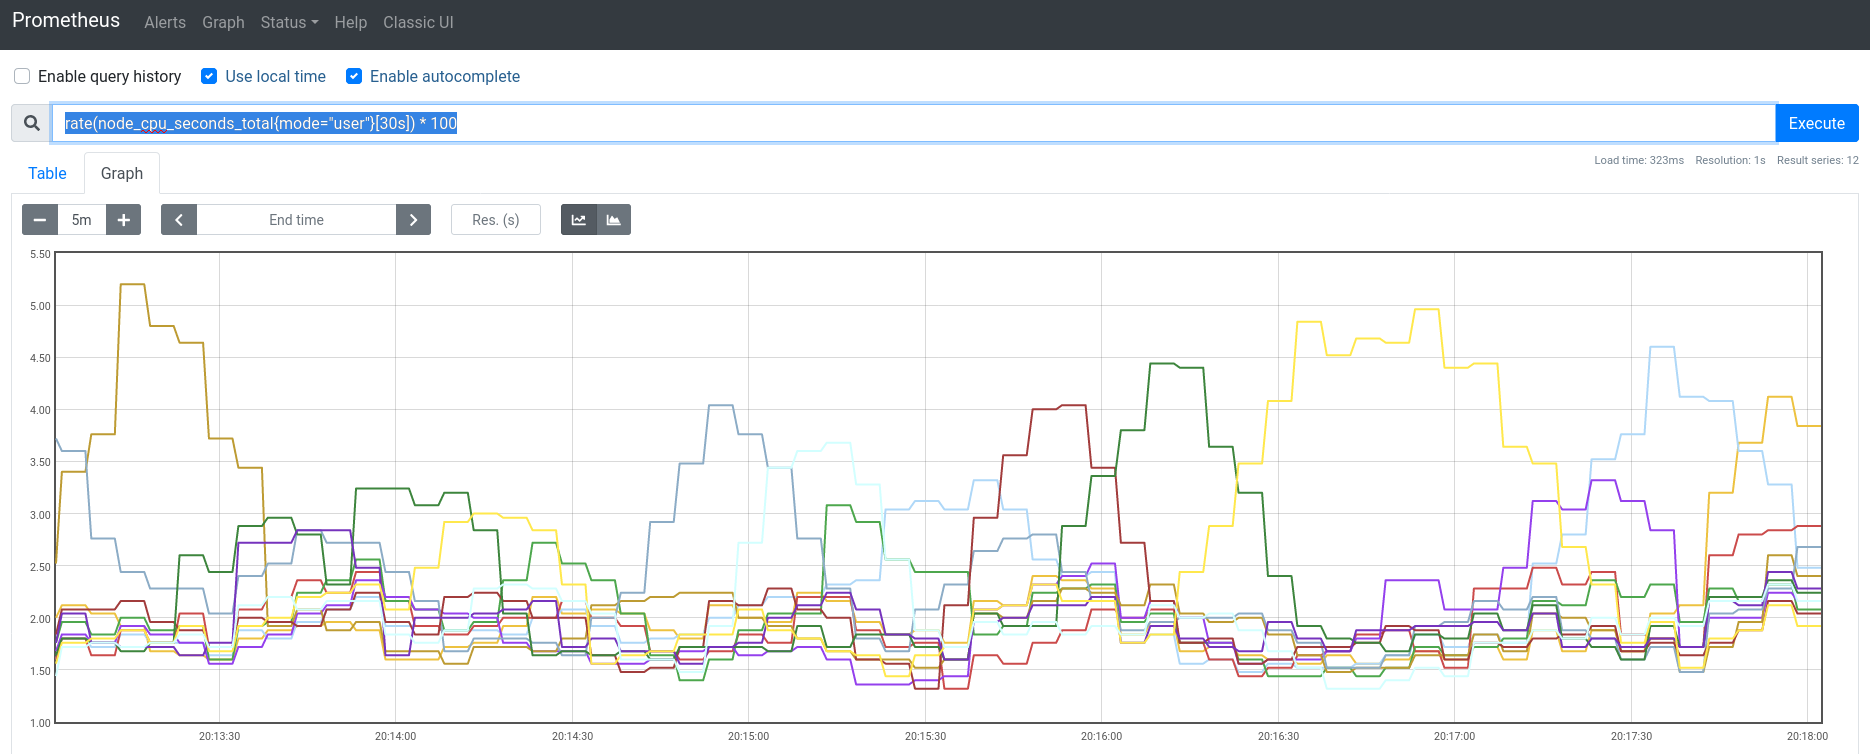
Easy peasy! After port-forwarding the instance with a k port-forward daemonset/prometheus :9090 -n monitoring, I queried for rate(node_cpu_seconds_total{mode="user"}[30s]) * 100 (adapted from an SO result) to get the CPU user-time load and it looked pretty reasonable:
Nice and uneventful! While we’re here I’ll also updated node_exporter as well in one shot (it doesn’t really have release notes I can go through, and technically every version should work for supported metrics, regressions would brick people). While looking I did see something neat, some of the pieces in the monitoring namespace have been running for years:
$ k get pods -n monitoring
NAME                                                             READY   STATUS    RESTARTS   AGE
jaeger-544694c5cc-jqqcs                                          1/1     Running   13         456d
node-exporter-88lf5                                              1/1     Running   0          12s
prometheus-k4njx                                                 1/1     Running   0          17m
pvc-a4d90256-3fbb-11e9-b40c-8c89a517d15e-ctrl-68d6f4ccf4-49mb7   2/2     Running   16         456d
pvc-a4d90256-3fbb-11e9-b40c-8c89a517d15e-rep-f8b86995b-fv67z     1/1     Running   15         2y16d <--- wow!
statping-5dccffd446-bftkx                                        1/1     Running   7          456d
OK sidetrack over time to get back to actually installing NodeLocal DNSCache. The first thing is to rip apart the pieces in the sample configuration nodelocaldns.yaml file in the docs. Here’s what you get after substituting in the variables for naming (I chose 169.254.0.1 as my <node-local-address>):
node-local-dns.configmap.yaml:
---
# See https://kubernetes.io/docs/tasks/administer-cluster/nodelocaldns/
# IPVS instructions were followed
apiVersion: v1
kind: ConfigMap
metadata:
  name: node-local-dns
  namespace: kube-system
  labels:
    addonmanager.kubernetes.io/mode: Reconcile
data:
  Corefile: |
    cluster.local:53 {
        errors
        cache {
                success 9984 30
                denial 9984 5
        }
        reload
        loop
        bind 169.254.0.1
        forward . 10.96.0.10 {
                force_tcp
        }
        prometheus :9253
        health 169.254.0.1:9090
        }
    in-addr.arpa:53 {
        errors
        cache 30
        reload
        loop
        bind 169.254.0.1
        forward . 10.96.0.10 {
                force_tcp
        }
        prometheus :9253
        }
    ip6.arpa:53 {
        errors
        cache 30
        reload
        loop
        bind 169.254.0.1
        forward . 10.96.0.10 {
                force_tcp
        }
        prometheus :9253
        }
    .:53 {
        errors
        cache 30
        reload
        loop
        bind 169.254.0.1
        forward . __PILLAR__UPSTREAM__SERVERS__
        prometheus :9253
        }
node-local-dns.ds.yaml:
---
apiVersion: apps/v1
kind: DaemonSet
metadata:
  name: node-local-dns
  namespace: kube-system
  labels:
    k8s-app: node-local-dns
    kubernetes.io/cluster-service: "true"
    addonmanager.kubernetes.io/mode: Reconcile
spec:
  updateStrategy:
    rollingUpdate:
      maxUnavailable: 10%
  selector:
    matchLabels:
      k8s-app: node-local-dns
  template:
    metadata:
      labels:
        k8s-app: node-local-dns
      annotations:
        prometheus.io/port: "9253"
        prometheus.io/scrape: "true"
    spec:
      priorityClassName: system-node-critical
      serviceAccountName: node-local-dns
      hostNetwork: true
      dnsPolicy: Default  # Don't use cluster DNS.
      tolerations:
      - key: "CriticalAddonsOnly"
        operator: "Exists"
      - effect: "NoExecute"
        operator: "Exists"
      - effect: "NoSchedule"
        operator: "Exists"
      containers:
      - name: node-cache
        image: k8s.gcr.io/dns/k8s-dns-node-cache:1.17.0
        resources:
          requests:
            cpu: 25m
            memory: 5Mi
        args: [
        "-localip", "169.254.0.1",
        "-conf", "/etc/Corefile",
        "-upstreamsvc", "kube-dns-upstream"
        ]
        securityContext:
          privileged: true
        ports:
        - containerPort: 53
          name: dns
          protocol: UDP
        - containerPort: 53
          name: dns-tcp
          protocol: TCP
        - containerPort: 9253
          name: metrics
          protocol: TCP
        livenessProbe:
          httpGet:
            host: 169.254.0.1
            path: /health
            port: 9090
          initialDelaySeconds: 60
          timeoutSeconds: 5
        volumeMounts:
        - mountPath: /run/xtables.lock
          name: xtables-lock
          readOnly: false
        - name: config-volume
          mountPath: /etc/coredns
        - name: kube-dns-config
          mountPath: /etc/kube-dns
      volumes:
      - name: xtables-lock
        hostPath:
          path: /run/xtables.lock
          type: FileOrCreate
      - name: kube-dns-config
        configMap:
          name: kube-dns
          optional: true
      - name: config-volume
        configMap:
          name: node-local-dns
          items:
            - key: Corefile
              path: Corefile.base
node-local-dns.serviceaccount.yaml:
apiVersion: v1
kind: ServiceAccount
metadata:
  name: node-local-dns
  namespace: kube-system
  labels:
    kubernetes.io/cluster-service: "true"
    addonmanager.kubernetes.io/mode: Reconcile
node-local-dns.svc.yaml:
---
# A headless service is a service with a service IP but instead of load-balancing it will return the IPs of our associated Pods.
# We use this to expose metrics to Prometheus.
apiVersion: v1
kind: Service
metadata:
  name: node-local-dns
  namespace: kube-system
  annotations:
    prometheus.io/port: "9253"
    prometheus.io/scrape: "true"
  labels:
    k8s-app: node-local-dns
spec:
  selector:
    k8s-app: node-local-dns
  clusterIP: None
  ports:
    - name: metrics
      port: 9253
      targetPort: 9253
kube-dns-upstream.svc.yaml
---
apiVersion: v1
kind: Service
metadata:
  name: kube-dns-upstream
  namespace: kube-system
  labels:
    k8s-app: kube-dns
    kubernetes.io/cluster-service: "true"
    addonmanager.kubernetes.io/mode: Reconcile
    kubernetes.io/name: "KubeDNSUpstream"
spec:
  ports:
  - name: dns
    port: 53
    protocol: UDP
    targetPort: 53
  - name: dns-tcp
    port: 53
    protocol: TCP
    targetPort: 53
  selector:
    k8s-app: kube-dns
And a Makefile to put them all together:
.PHONY: install configmap ds svc serviceaccount rbac

KUBECTL ?= kubectl

install: configmap serviceaccount svc ds

configmap:
    $(KUBECTL) apply -f node-local-dns.configmap.yaml

serviceaccount:
    $(KUBECTL) apply -f node-local-dns.serviceaccount.yaml

svc:
    $(KUBECTL) apply -f node-local-dns.svc.yaml
    $(KUBECTL) apply -f kube-dns-upstream.svc.yaml

ds:
    $(KUBECTL) apply -f node-local-dns.ds.yaml

uninstall:
    $(KUBECTL) delete -f node-local-dns.svc.yaml
    $(KUBECTL) delete -f kube-dns-upstream.svc.yaml
    $(KUBECTL) delete -f node-local-dns.ds.yaml
    $(KUBECTL) delete -f node-local-dns.serviceaccount.yaml
    $(KUBECTL) delete -f node-local-dns.configmap.yaml
Pretty simple to understand the pieces when you break them apart – we’re adding a DaemonSet coredns instance that lives on every node, and making it available via a service, while keeping the upstream available as well. The installation process is pretty straight forward as well, though it does need a little bit of information entered (like the Cluster IP), which is already substituted in above as you can see.
One thing I ran into was when I restarted the kubelet after modifying /var/lib/kubelet/config.yaml to add the node-local-address (mentioned in the guide) under the clusterDNS option in the configuration. It looks like the version of Kubernetes I’m currently running is not OK with the --bootstrap-kubeconfig being there at all! I’m running 1.17 so although the instructions say this:
The KubeConfig file to use for the TLS Bootstrap is /etc/kubernetes/bootstrap-kubelet.conf, but it is only used if /etc/kubernetes/kubelet.conf does not exist.
The logs coming from systemd (journalctl -xe -u kubelet -f) look like this:
-- The start-up result is RESULT.
Mar 22 14:21:56 ubuntu-1810-cosmic-64-minimal kubelet[30563]: Flag --resolv-conf has been deprecated, This parameter should be set via the config file specified by the Kubelet's --config flag. See https://kubernetes.io/docs/tasks/administer-cluster/kubelet-config-file/ for more information.
Mar 22 14:21:56 ubuntu-1810-cosmic-64-minimal kubelet[30563]: Flag --resolv-conf has been deprecated, This parameter should be set via the config file specified by the Kubelet's --config flag. See https://kubernetes.io/docs/tasks/administer-cluster/kubelet-config-file/ for more information.
Mar 22 14:21:56 ubuntu-1810-cosmic-64-minimal kubelet[30563]: I0322 14:21:56.868089   30563 server.go:416] Version: v1.17.11
Mar 22 14:21:56 ubuntu-1810-cosmic-64-minimal kubelet[30563]: I0322 14:21:56.868425   30563 plugins.go:100] No cloud provider specified.
Mar 22 14:21:56 ubuntu-1810-cosmic-64-minimal kubelet[30563]: I0322 14:21:56.868452   30563 server.go:822] Client rotation is on, will bootstrap in background
Mar 22 14:21:56 ubuntu-1810-cosmic-64-minimal kubelet[30563]: E0322 14:21:56.871389   30563 bootstrap.go:265] part of the existing bootstrap client certificate is expired: 2020-12-20 06:50:06 +0000 UTC
Mar 22 14:21:56 ubuntu-1810-cosmic-64-minimal kubelet[30563]: F0322 14:21:56.871433   30563 server.go:273] failed to run Kubelet: unable to load bootstrap kubeconfig: stat /etc/kubernetes/bootstrap-kubelet.conf: no such file or directory
Mar 22 14:21:56 ubuntu-1810-cosmic-64-minimal systemd[1]: kubelet.service: Main process exited, code=exited, status=255/n/a
Mar 22 14:21:56 ubuntu-1810-cosmic-64-minimal systemd[1]: kubelet.service: Failed with result 'exit-code'.
The fix for this was to remove the --bootstrap-kubelet flag as the /etc/kubernetes/kubelet.conf file certainly exists (and I’ve also backed that up as well).
After fixing the kubelet issue, I saw in the logs almost immediately that I made a separate mistake – misconfiguring the node-local-dns DaemonSet – I left a trailing , in the -localip setting because I was following the directions too literally. Error looked like this:
$ k logs node-local-dns-q577j -n kube-system
2021/03/22 14:28:23 [INFO] Starting node-cache image: 1.17.0
2021/03/22 14:28:23 [FATAL] Error parsing flags - invalid localip specified - "", Exiting
Pretty easy fix of course (just remove the trailing ,) and re-ran to find the following:
2021/03/22 14:36:15 [INFO] Updated Corefile with 0 custom stubdomains and upstream servers /etc/resolv.conf
2021/03/22 14:36:15 [INFO] Using config file:
<redacted>
listen tcp 169.254.0.1:8080: bind: address already in use
Somehow the healthcheck at port 8080 was in use so I just went with 9090 by changing the line in the ConfigMap that used it. Along with that I had to change the DaemonSet configuration to check 9090 instead of 8080 as well. After that it was purring along nicely:
$ k get pods -n kube-system
NAME                                                    READY   STATUS    RESTARTS   AGE
coredns-6955765f44-2tdlt                                1/1     Running   0          208d
coredns-6955765f44-jxpcn                                1/1     Running   0          208d
etcd-ubuntu-1810-cosmic-64-minimal                      1/1     Running   2          216d
kube-apiserver-ubuntu-1810-cosmic-64-minimal            1/1     Running   8          216d
kube-controller-manager-ubuntu-1810-cosmic-64-minimal   1/1     Running   3          216d
kube-router-jr66k                                       1/1     Running   0          18d
kube-scheduler-ubuntu-1810-cosmic-64-minimal            1/1     Running   3          216d
To check that things were working I followed this process:
kubectl exec -it into an innocuous container (in my case an instance of statping) and perform a wget to another service (<some service>.<namespace>) as a sanity check/etc/resolv.conf of an existing non-critical container , to ensure it showed nameserver 10.96.0.10 (the old non-cluster-local DNS)Deployment (and the pod, resultingly) with kubectl rollout restartkubectl exec -it back in to the container and check the changed /etc/resolv.conf and confirm that it contains nameserver 169.254.0.1wget sanity check againThere are lots of variations on the above process to take, but the above is generally the simplest way to check I think (doesn’t require being a DNS expert) – just check DNS however you’re comfortable. Another way to check is with dig (which comes with the BIND toolset):
/app # apk add bind-tools
< apk output elided >
/app # dig prometheus.montioring

; <<>> DiG 9.12.4-P2 <<>> prometheus.montioring
;; global options: +cmd
;; Got answer:
;; ->>HEADER<<- opcode: QUERY, status: NXDOMAIN, id: 30464
;; flags: qr rd ra ad; QUERY: 1, ANSWER: 0, AUTHORITY: 1, ADDITIONAL: 1

;; OPT PSEUDOSECTION:
; EDNS: version: 0, flags:; udp: 4096
;; QUESTION SECTION:
;prometheus.montioring.         IN      A

;; AUTHORITY SECTION:
.                       30      IN      SOA     a.root-servers.net. nstld.verisign-grs.com. 2021032302 1800 900 604800 86400

;; Query time: 52 msec
;; SERVER: 169.254.0.1#53(169.254.0.1)
;; WHEN: Wed Mar 24 01:09:36 UTC 2021
;; MSG SIZE  rcvd: 125
As you can see there dig is in the bind-tools alpine package, and the nameserver it uses is indeed 169.254.0.1 (which is our local DNS!).
Speaking of Prometheus though, one more way I can check to see that things are working is to look at the coredns_dns_request_duration_seconds_bucket metric for my node-local-dns target in prometheus:
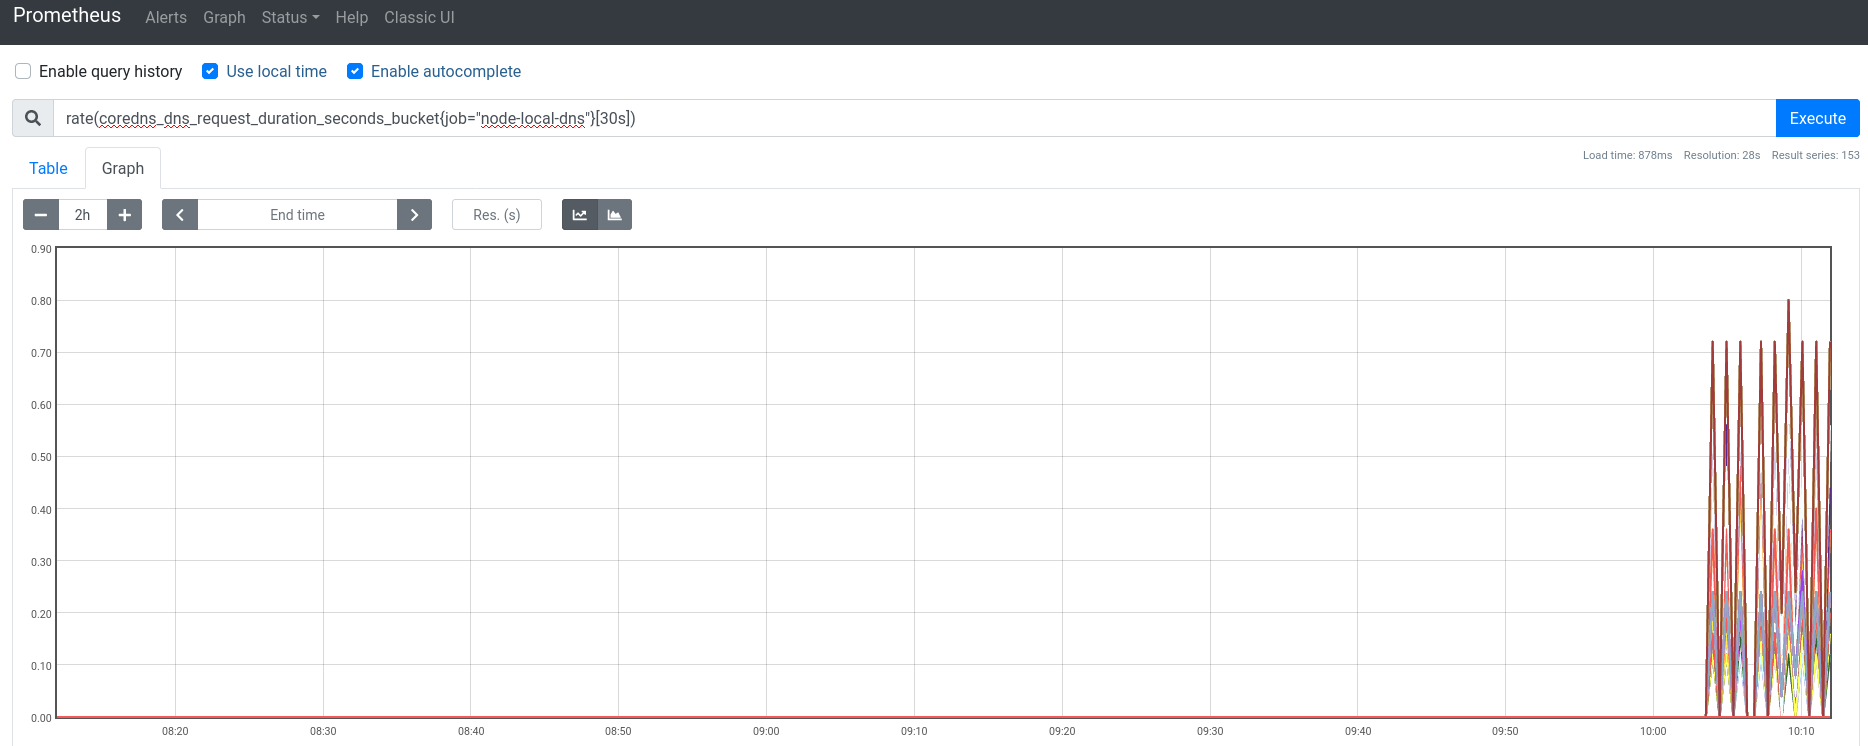
Looks good to me – as pods and other things get restarted, they’ll be using the NodeLocal DNSCache.
So Jaeger is another nice small “tight” dependency like Prometheus – I don’t expect to have much trouble going from version v1.3.0 (I’m using the jaegertracing/all-in-one image) to v1.22.0, a 19 version jump. Here’s what stuck out to me while reading the release notes on the way:
jaeger-standalone binary has been renamed to jaeger-all-in-one(#1062)
jaegertracing/jaeger-all-in-oneOK so the list was getting long and this post is already long enough so I’m not leaving any other notes (a lot of the release notes were actually really interesting, large impact features being merged in!). First I’m going to try going all the way in one fell swoop – Since I’ve been using the all-in-one server and actually don’t even have any external long term storage running or any real configuration options specified, I think I might be OK.
Aaand it was easy peasy:
Running the all-in-one image with the embedded Badger based DB is nice and simple and just what I need. I also went down a rabbit hold of lots of cool badger based project, but that’s a discussion for another time.
While working on upgrading Traefik I found that the zipkin port wasn’t working I’d get errors like these coming out of Traefik:
2021/03/24 10:14:06 failed to send the request: Post "http://jaeger.monitoring.svc.cluster.local:9411/api/v2/spans": dial tcp 10.100.45.51:9411: connect: connection refused
2021/03/24 10:14:07 failed to send the request: Post "http://jaeger.monitoring.svc.cluster.local:9411/api/v2/spans": dial tcp 10.100.45.51:9411: connect: connection refused
2021/03/24 10:14:08 failed to send the request: Post "http://jaeger.monitoring.svc.cluster.local:9411/api/v2/spans": dial tcp 10.100.45.51:9411: connect: connection refused
And the fix was to change the configuration I was using:
modified   kubernetes/monitoring/jaeger/jaeger.deployment.yaml
@@ -19,9 +19,8 @@ spec:
       containers:
       - name: jaeger
         image: jaegertracing/all-in-one:1.22.0
-        env:
-        - name: COLLECTOR_ZIPKIN_HTTP_PORT
-          value: "9411"
+        args:
+          - --collector.zipkin.host-port=:9411
         ports:
           - name: zipkin
             containerPort: 9411
After recently having to upgrade Cert Manager in a hurry, I can finally be a little bit more calm and go up to the newest version, v1.2.0 (from v0.16.0). There is a big scary notification that the minimum supported Kubernetes version is now 1.16.0 but luckily I don’t have to worry about that since I’m running 1.17! I’ll do a quick run through of the big/interesting changes in between the versions since there aren’t so many:
kubectl cert-manager status for investigation
kubectl plugin][kubectl-docs-plugins]!OK looks like I’m good to go, I just need to check the versions of cainjector and webhook deployments that go the cert-manager deployment. I did this by downloading the released YAML file and digging through it – turns out they’re all synchronized on the same version, so all I need to do is change the image lines everywhere to the same version, nice and easy.
Uh-oh looks like I have a problem:
E0324 02:53:33.885669       1 reflector.go:127] external/io_k8s_client_go/tools/cache/reflector.go:156: Failed to watch *v1.ClusterIssuer: failed to list *v1.ClusterIssuer: the server could not find the requested resource (get clusterissuers.cert-manager.io)
E0324 02:53:34.225213       1 reflector.go:127] external/io_k8s_client_go/tools/cache/reflector.go:156: Failed to watch *v1beta1.Ingress: failed to list *v1beta1.Ingress: ingresses.networking.k8s.io is forbidden: User "system:serviceaccount:cert-manager:cluster-cert-manager" cannot list resource "ingresses" in API group "networking.k8s.io" at the cluster scope
E0324 02:53:34.617991       1 reflector.go:127] external/io_k8s_client_go/tools/cache/reflector.go:156: Failed to watch *v1.Issuer: failed to list *v1.Issuer: the server could not find the requested resource (get issuers.cert-manager.io)
E0324 02:53:35.206101       1 reflector.go:127] external/io_k8s_client_go/tools/cache/reflector.go:156: Failed to watch *v1.CertificateRequest: failed to list *v1.CertificateRequest: the server could not find the requested resource (get certificaterequests.cert-manager.io)
E0324 02:53:36.024811       1 reflector.go:127] external/io_k8s_client_go/tools/cache/reflector.go:156: Failed to watch *v1.Order: failed to list *v1.Order: the server could not find the requested resource (get orders.acme.cert-manager.io)
E0324 02:53:36.702036       1 reflector.go:127] external/io_k8s_client_go/tools/cache/reflector.go:156: Failed to watch *v1.Challenge: failed to list *v1.Challenge: the server could not find the requested resource (get challenges.acme.cert-manager.io)
Of course – I forgot to check the CRDs and update/upgrade all of them as well. Also, the changes to the CRDs looks to have affected the RBAC settings because they need to refer to the new versions. After reverting things look good again:
$ k logs -f cert-manager-7cd497dcd7-jbn9t -n cert-manager
I0324 02:56:21.716188       1 start.go:74] cert-manager "msg"="starting controller"  "git-commit"="a7f8065abe6b74cbed35e79e4d646a38eb7ad6ae" "version"="v0.16.1"
W0324 02:56:21.716252       1 client_config.go:552] Neither --kubeconfig nor --master was specified.  Using the inClusterConfig.  This might not work.
I0324 02:56:21.717787       1 controller.go:162] cert-manager/controller/build-context "msg"="configured acme dns01 nameservers" "nameservers"=["169.254.0.1:53"]
I0324 02:56:21.718686       1 controller.go:125] cert-manager/controller "msg"="starting leader election"
I0324 02:56:21.718905       1 metrics.go:160] cert-manager/controller/build-context/metrics "msg"="listening for connections on" "address"={"IP":"::","Port":9402,"Zone":""}
I0324 02:56:21.720002       1 leaderelection.go:242] attempting to acquire leader lease  cert-manager/cert-manager-controller...
I0324 02:57:32.941986       1 leaderelection.go:252] successfully acquired lease cert-manager/cert-manager-controller
I0324 02:57:32.942430       1 controller.go:99] cert-manager/controller "msg"="starting controller" "controller"="issuers"
I0324 02:57:32.942481       1 controller.go:100] cert-manager/controller/issuers "msg"="starting control loop"
I0324 02:57:32.942728       1 controller.go:99] cert-manager/controller "msg"="starting controller" "controller"="CertificateIssuing"
I0324 02:57:32.942776       1 controller.go:99] cert-manager/controller "msg"="starting controller" "controller"="CertificateReadiness"
I0324 02:57:32.942789       1 controller.go:100] cert-manager/controller/CertificateIssuing "msg"="starting control loop"
.... lots more logs ...
I0324 02:57:38.082495       1 controller.go:162] cert-manager/controller/clusterissuers "msg"="finished processing work item" "key"="letsencrypt-prod"
I0324 02:57:38.082414       1 setup.go:165] cert-manager/controller/clusterissuers "msg"="skipping re-verifying ACME account as cached registration details look sufficient" "related_resource_kind"="Secret" "related_resource_name"="letsencrypt-staging" "related_resource_namespace"="cert-manager" "resource_kind"="ClusterIssuer" "resource_name"="letsencrypt-staging" "resource_namespace"=""
I0324 02:57:38.082542       1 controller.go:162] cert-manager/controller/clusterissuers "msg"="finished processing work item" "key"="letsencrypt-staging"
Good to see things are back to normal, now let’s di start digging through that released YAML file (link above) again to find which CRDs have changed and how I needed to change RBAC/other YAML…
I’m going to cut it out of here but I spent at least 1 hour just going through and merging (mostly replacing, really) my CRDs and making sure everything matched up. This was a long process that I’m going to save you from having to read me squawk about.
cert-managerlooks to have factored out alot of RBAC and other settings and things and basically adding all those and making sure everything was in place was PITA but should ensure that things are hard to parse/reason about later.
Newer versions of Cert Manager effectively break apart and separate all their permissiong (generally a good thing) into various little ClusterRoless, and that means I had to apply all of them (i.e. apply ClusterRoleBindings) to the ServiceAccount used by the cert-manager Deployment, quite a PITA but Cert Manager provides an unreasonable amount of value to me so I stuck with it. After working through all the YAML rewriting and Makefile changes, everything looks to be working well again on the new v1.2.0 version:
$ k logs -f cert-manager-5b6b75c775-r9f8h -n cert-manager
I0324 09:23:56.457193       1 start.go:74] cert-manager "msg"="starting controller"  "git-commit"="969b678f330c68a6429b7a71b271761c59651a85" "version"="v1.2.0"
W0324 09:23:56.457258       1 client_config.go:608] Neither --kubeconfig nor --master was specified.  Using the inClusterConfig.  This might not work.
I0324 09:23:56.459269       1 controller.go:169] cert-manager/controller/build-context "msg"="configured acme dns01 nameservers" "nameservers"=["169.254.0.1:53"]
I0324 09:23:56.461420       1 controller.go:129] cert-manager/controller "msg"="starting leader election"
I0324 09:23:56.461595       1 metrics.go:166] cert-manager/controller/build-context/metrics "msg"="listening for connections on" "address"={"IP":"::","Port":9402,"Zone":""}
I0324 09:23:56.462695       1 leaderelection.go:243] attempting to acquire leader lease  cert-manager/cert-manager-controller...
I0324 09:25:06.850330       1 leaderelection.go:253] successfully acquired lease cert-manager/cert-manager-controller
I0324 09:25:06.850786       1 controller.go:103] cert-manager/controller "msg"="starting controller" "controller"="certificaterequests-issuer-acme"
I0324 09:25:06.850849       1 controller.go:103] cert-manager/controller "msg"="starting controller" "controller"="certificaterequests-issuer-venafi"
I0324 09:25:06.850849       1 controller.go:103] cert-manager/controller "msg"="starting controller" "controller"="certificaterequests-issuer-ca"
I0324 09:25:06.850918       1 controller.go:103] cert-manager/controller "msg"="starting controller" "controller"="CertificateReadiness"
I0324 09:25:06.851017       1 controller.go:103] cert-manager/controller "msg"="starting controller" "controller"="CertificateRequestManager"
I0324 09:25:06.851030       1 controller.go:103] cert-manager/controller "msg"="starting controller" "controller"="clusterissuers"
I0324 09:25:06.852286       1 reflector.go:207] Starting reflector *v1.Secret (5m0s) from external/io_k8s_client_go/tools/cache/reflector.go:156
I0324 09:25:06.952419       1 controller.go:103] cert-manager/controller "msg"="starting controller" "controller"="challenges"
I0324 09:25:06.952581       1 controller.go:103] cert-manager/controller "msg"="starting controller" "controller"="certificaterequests-issuer-selfsigned"
I0324 09:25:06.952646       1 controller.go:103] cert-manager/controller "msg"="starting controller" "controller"="certificaterequests-issuer-vault"
I0324 09:25:06.952750       1 controller.go:103] cert-manager/controller "msg"="starting controller" "controller"="CertificateIssuing"
I0324 09:25:06.952972       1 controller.go:103] cert-manager/controller "msg"="starting controller" "controller"="ingress-shim"
I0324 09:25:06.953135       1 controller.go:103] cert-manager/controller "msg"="starting controller" "controller"="orders"
I0324 09:25:06.953215       1 controller.go:103] cert-manager/controller "msg"="starting controller" "controller"="CertificateKeyManager"
I0324 09:25:06.953282       1 controller.go:103] cert-manager/controller "msg"="starting controller" "controller"="CertificateMetrics"
I0324 09:25:06.953393       1 controller.go:103] cert-manager/controller "msg"="starting controller" "controller"="CertificateTrigger"
I0324 09:25:06.953485       1 reflector.go:207] Starting reflector *v1.Pod (10h0m0s) from external/io_k8s_client_go/tools/cache/reflector.go:156
I0324 09:25:06.953516       1 reflector.go:207] Starting reflector *v1.Order (10h0m0s) from external/io_k8s_client_go/tools/cache/reflector.go:156
I0324 09:25:06.953527       1 reflector.go:207] Starting reflector *v1.Service (10h0m0s) from external/io_k8s_client_go/tools/cache/reflector.go:156
I0324 09:25:06.953565       1 controller.go:103] cert-manager/controller "msg"="starting controller" "controller"="issuers"
I0324 09:25:06.953656       1 reflector.go:207] Starting reflector *v1.Secret (10h0m0s) from external/io_k8s_client_go/tools/cache/reflector.go:156
I0324 09:25:06.953520       1 reflector.go:207] Starting reflector *v1.ClusterIssuer (10h0m0s) from external/io_k8s_client_go/tools/cache/reflector.go:156
I0324 09:25:06.953812       1 reflector.go:207] Starting reflector *v1beta1.Ingress (10h0m0s) from external/io_k8s_client_go/tools/cache/reflector.go:156
I0324 09:25:06.953875       1 reflector.go:207] Starting reflector *v1.Challenge (10h0m0s) from external/io_k8s_client_go/tools/cache/reflector.go:156
I0324 09:25:06.953906       1 reflector.go:207] Starting reflector *v1.Issuer (10h0m0s) from external/io_k8s_client_go/tools/cache/reflector.go:156
I0324 09:25:06.954014       1 reflector.go:207] Starting reflector *v1.CertificateRequest (10h0m0s) from external/io_k8s_client_go/tools/cache/reflector.go:156
I0324 09:25:06.953675       1 reflector.go:207] Starting reflector *v1.Certificate (10h0m0s) from external/io_k8s_client_go/tools/cache/reflector.go:156
I0324 09:25:07.051791       1 setup.go:170] cert-manager/controller/clusterissuers "msg"="skipping re-verifying ACME account as cached registration details look sufficient" "related_resource_kind"="Secret" "related_resource_name"="letsencrypt-staging" "related_resource_namespace"="cert-manager" "resource_kind"="ClusterIssuer" "resource_name"="letsencrypt-staging" "resource_namespace"="" "resource_version"="v1"
I0324 09:25:07.051910       1 setup.go:170] cert-manager/controller/clusterissuers "msg"="skipping re-verifying ACME account as cached registration details look sufficient" "related_resource_kind"="Secret" "related_resource_name"="letsencrypt-prod" "related_resource_namespace"="cert-manager" "resource_kind"="ClusterIssuer" "resource_name"="letsencrypt-prod" "resource_namespace"="" "resource_version"="v1"
I0324 09:25:11.985177       1 setup.go:170] cert-manager/controller/clusterissuers "msg"="skipping re-verifying ACME account as cached registration details look sufficient" "related_resource_kind"="Secret" "related_resource_name"="letsencrypt-staging" "related_resource_namespace"="cert-manager" "resource_kind"="ClusterIssuer" "resource_name"="letsencrypt-staging" "resource_namespace"="" "resource_version"="v1"
I0324 09:25:11.985191       1 setup.go:170] cert-manager/controller/clusterissuers "msg"="skipping re-verifying ACME account as cached registration details look sufficient" "related_resource_kind"="Secret" "related_resource_name"="letsencrypt-prod" "related_resource_namespace"="cert-manager" "resource_kind"="ClusterIssuer" "resource_name"="letsencrypt-prod" "resource_namespace"="" "resource_version"="v1"
Nice, that’s what it’s supposed to look like! I also took a look at the logs for cainjector and webhook and everything looks good there as well.
I had noted some pretty nice features(PROXY protocol support for TCP services, mTLS, etc) coming in 2.4.0-rc.1, but since v2.4.8 is out, might as well go to that, taking some time to look at changes since v2.3.2 and see if anything poses a risk or is exciting. Here’s the stuff that I’m scared of/excited about:
<organization>.domain.tld addresseshtpasswd instructions this is awesomeOne interesting thing worth mentioning separately is the Kubernetes Service APIs which are pretty interesting – took some time to read through the proposals that the SIG is working on and they’re nice! Hopefully it’ll be a bit easier to switch from Traefik’s CRDs to those and feature parity will be there. All in all there wasn’t too much to worry about breaking so the upgrade was pretty easy to do, just the image: ... change… right?
Of course, because things always go wrong, something went wrong – I was greeted with the self-signed cert page after updating the image on the Traefik DaemonSet:
Excellent, so I have no idea what could have broken the certs but I need to figure that out. Along the way I also see these errors:
2021/03/24 09:46:29 failed to send the request: Post "http://jaeger.monitoring.svc.cluster.local:9411/api/v2/spans": dial tcp 10.100.45.51:9411: connect: connection refused
time="2021-03-24T09:46:29Z" level=error msg="kubernetes service not found: experiments/pm2-benchmark-ew4qml6" namespace=experiments providerName=kubernetescrd ingress=pm2-benchmark-ew4qml6
176.9.30.135 - - [24/Mar/2021:09:46:29 +0000] "GET /ping HTTP/1.1" 200 2 "-" "-" 74 "ping@internal" "-" 0ms
time="2021-03-24T09:46:29Z" level=error msg="kubernetes service not found: experiments/pm2-benchmark-ew4qml6" namespace=experiments providerName=kubernetescrd ingress=pm2-benchmark-ew4qml6
time="2021-03-24T09:46:29Z" level=error msg="kubernetes service not found: experiments/pm2-benchmark-ew4qml6" providerName=kubernetescrd ingress=pm2-benchmark-ew4qml6 namespace=experiments
time="2021-03-24T09:46:29Z" level=error msg="kubernetes service not found: experiments/pm2-benchmark-ew4qml6" namespace=experiments providerName=kubernetescrd ingress=pm2-benchmark-ew4qml6
2021/03/24 09:46:30 failed to send the request: Post "http://jaeger.monitoring.svc.cluster.local:9411/api/v2/spans": dial tcp 10.100.45.51:9411: connect: connection refused
Few issues here:
IngressRoute hanging around somewhere from back when I was doing my PM2 benchmark experimentjaeger instance can’t be reached… Why is it trying to hit /api/v2/spans off of Zipkin-style trace port?While I’m here I should probably fix these issue then try to work my way to the exact traefik version that is causing my real issue. At least the PM2 issue wasn’t too hard to solve:
$ k get ingressroute -n experiments
NAME                    AGE
pm2-benchmark-ew4qml6   42d
$ k delete ingressroute pm2-benchmark-ew4qml6 -n experiments
ingressroute.traefik.containo.us "pm2-benchmark-ew4qml6" deleted
And the Jaeger issue wasn’t hard, it’s just that I’d actually never set up the internal jaeger service (@ jaeger.monitoring.svc.cluster.local) properly. You can find all the port assignments in the Jaeger docs. Here’s what the diff looked like for me
modified   kubernetes/monitoring/jaeger/jaeger.svc.yaml
@@ -10,9 +10,26 @@ spec:
   selector:
     app: jaeger
   ports:
-    - name: jaeger-agent-zipkin
-      protocol: TCP
-      port: 9411
+    # Querying
     - name: jaeger-query
       protocol: TCP
       port: 16686
+    # Collection
+    - name: zipkin
+      protocol: TCP
+      port: 9411
+    - name: zipkin-thrift
+      protocol: UDP
+      port: 5775
+    - name: jaeger-thrift-compact
+      protocol: UDP
+      port: 6831
+    - name: jaeger-thrift-binary
+      protocol: UDP
+      port: 6832
+    - name: jaeger-thrift-clients
+      protocol: TCP
+      port: 14268
+    - name: model-proto
+      protocol: TCP
+      port: 14250
After these changes the logs were nice and clean again. Now it’s time to get to the bottom of the Traefik issue…
I tried to original go from v2.3.2 to 2.4.8 but let’s do some adhoc bisecting:
OK, so it looks like one of the changes from v2.4.0 is to blame. I also can’t find anything in the minor migration notes to suggest that there is a large difference between v2.3.x and v2.4.x… Let’s see if I can find some bad log lines:
$ k logs traefik-k5mqp -f -n ingress
time="2021-03-24T10:32:53Z" level=info msg="Configuration loaded from file: /etc/traefik/config/static/traefik.toml"
time="2021-03-24T10:32:53Z" level=info msg="Traefik version 2.4.0 built on 2021-01-19T17:26:51Z"
time="2021-03-24T10:32:53Z" level=info msg="\nStats collection is disabled.\nHelp us improve Traefik by turning this feature on :)\nMore details on: https://doc.traefik.io/traefik/contributing/data-collection/\n"
time="2021-03-24T10:32:53Z" level=info msg="Starting provider aggregator.ProviderAggregator {}"
time="2021-03-24T10:32:53Z" level=info msg="Starting provider *crd.Provider {\"allowCrossNamespace\":true}"
time="2021-03-24T10:32:53Z" level=info msg="label selector is: \"\"" providerName=kubernetescrd
time="2021-03-24T10:32:53Z" level=info msg="Creating in-cluster Provider client" providerName=kubernetescrd
time="2021-03-24T10:32:53Z" level=info msg="Starting provider *traefik.Provider {}"
time="2021-03-24T10:32:53Z" level=info msg="Starting provider *ingress.Provider {}"
time="2021-03-24T10:32:53Z" level=info msg="ingress label selector is: \"\"" providerName=kubernetes
time="2021-03-24T10:32:53Z" level=info msg="Creating in-cluster Provider client" providerName=kubernetes
time="2021-03-24T10:32:53Z" level=info msg="Starting provider *acme.ChallengeTLSALPN {\"Timeout\":2000000000}"
time="2021-03-24T10:32:53Z" level=warning msg="Cross-namespace reference between IngressRoutes and resources is enabled, please ensure that this is expected (see AllowCrossNamespace option)" providerName=kubernetescrd
E0324 10:32:53.976017       1 reflector.go:127] pkg/mod/k8s.io/client-go@v0.19.2/tools/cache/reflector.go:156: Failed to watch *v1alpha1.ServersTransport: failed to list *v1alpha1.ServersTransport: serverstransports.traefik.containo.us is forbidden: User "system:serviceaccount:ingress:traefik" cannot list resource "serverstransports" in API group "traefik.containo.us" at the cluster scope
E0324 10:32:55.261138       1 reflector.go:127] pkg/mod/k8s.io/client-go@v0.19.2/tools/cache/reflector.go:156: Failed to watch *v1alpha1.ServersTransport: failed to list *v1alpha1.ServersTransport: serverstransports.traefik.containo.us is forbidden: User "system:serviceaccount:ingress:traefik" cannot list resource "serverstransports" in API group "traefik.containo.us" at the cluster scope
E0324 10:32:57.612684       1 reflector.go:127] pkg/mod/k8s.io/client-go@v0.19.2/tools/cache/reflector.go:156: Failed to watch *v1alpha1.ServersTransport: failed to list *v1alpha1.ServersTransport: serverstransports.traefik.containo.us is forbidden: User "system:serviceaccount:ingress:traefik" cannot list resource "serverstransports" in API group "traefik.containo.us" at the cluster scope
E03q
OK so it looks like there’s a new CRD that I don’t have… The ServersTransports YAML is available in the repo, but looks like the better place get it from is the docs page, which has the RBAC too. So time for me to break this apart and cross-check with what I have locally (kinda like cert manager), lots of fun! Here’s the little CRD that took me down:
---
apiVersion: apiextensions.k8s.io/v1beta1
kind: CustomResourceDefinition
metadata:
  name: serverstransports.traefik.containo.us
spec:
  scope: Namespaced
  group: traefik.containo.us
  version: v1alpha1
  names:
    kind: ServersTransport
    plural: serverstransports
    singular: serverstransport
Along with that CRD I was also missing this little change in the CluterRole I was using:
modified   kubernetes/cluster/ingress/traefik/traefik.clusterrole.yaml
@@ -40,6 +40,7 @@ rules:
       - ingressroutetcps
       - ingressrouteudps
       - tlsoptions
+      - serverstransports
       - tlsstores
     verbs:
       - get
After putting this in upgrade went nice and easily. It’s unfortunate that Traefik doesn’t publish the YAML it needs like cert manager does but at least it’s in the docs. Here’s the good log lines:
$ k logs traefik-97nkr -f -n ingress
time="2021-03-24T10:53:33Z" level=info msg="Configuration loaded from file: /etc/traefik/config/static/traefik.toml"
time="2021-03-24T10:53:33Z" level=info msg="Traefik version 2.4.0 built on 2021-01-19T17:26:51Z"
time="2021-03-24T10:53:33Z" level=info msg="\nStats collection is disabled.\nHelp us improve Traefik by turning this feature on :)\nMore details on: https://doc.traefik.io/traefik/contributing/data-collection/\n"
time="2021-03-24T10:53:33Z" level=info msg="Starting provider aggregator.ProviderAggregator {}"
time="2021-03-24T10:53:33Z" level=info msg="Starting provider *crd.Provider {\"allowCrossNamespace\":true}"
time="2021-03-24T10:53:33Z" level=info msg="label selector is: \"\"" providerName=kubernetescrd
time="2021-03-24T10:53:33Z" level=info msg="Creating in-cluster Provider client" providerName=kubernetescrd
time="2021-03-24T10:53:33Z" level=info msg="Starting provider *traefik.Provider {}"
time="2021-03-24T10:53:33Z" level=info msg="Starting provider *acme.ChallengeTLSALPN {\"Timeout\":2000000000}"
time="2021-03-24T10:53:33Z" level=info msg="Starting provider *ingress.Provider {}"
time="2021-03-24T10:53:33Z" level=info msg="ingress label selector is: \"\"" providerName=kubernetes
time="2021-03-24T10:53:33Z" level=info msg="Creating in-cluster Provider client" providerName=kubernetes
time="2021-03-24T10:53:33Z" level=warning msg="Cross-namespace reference between IngressRoutes and resources is enabled, please ensure that this is expected (see AllowCrossNamespace option)" providerName=kubernetescrd
Awesome, so now that v2.4.0 is working – I can go to v2.4.8. I think while I’m here I will disable cross-namespace ingress routes.
To cap everything off let’s change some technology underlying the whole cluster – containerd.
containerd’s release stream is a bit chaotic since they maintain main versions (X.Y) and release security patches (X.Y.Z) for previously released versions – but it looks like their latest non-beta version is 1.4.4, so I’ll be switching to that. After checking, it looks like up until now I’ve actually been installing the releases one by one on my node manually. This feels like a “yikes” but I’m not sure – software like containerd is so nicely packaged that it feels kind of nice to be able to not involved any package managers in deploying the new version.
I should be good to basically replace the binary (keeping a back up of course) and restart kubelet and see if everything is going fine – and if so, do a machine restart… Well both of these went great – containerd has officially been updated to v1.4.4. They’re on the verge of a v1.5.0 release but I think I won’t test my luck with that today. I’ll be happy with the fact that the most important change (the underlying container engine) was the easiest to make!
Another quick upgrade for kube-router (an incredibly important infrastructure piece) – I’ll be moving from v1.0.1 to v1.2.0. kube-router is pretty steady/stable software so there aren’t so many releases to look at but here’s what I found interesting:
None of the changes look to be too dangerous/breaking so I’ll enable metrics while I’m here and give the upgrade jump a shot, and take a look at the logs:
$ k logs -f kube-router-zf6h6 -n kube-system
I0324 11:36:21.422554       1 version.go:21] Running /usr/local/bin/kube-router version v1.2.0-dirty, built on 2021-03-24T05:46:55+0000, go1.15.8
I0324 11:36:21.524653       1 metrics_controller.go:175] Starting metrics controller
I0324 11:36:21.524834       1 health_controller.go:80] Received heartbeat from MC
E0324 11:36:21.524891       1 metrics_controller.go:190] Metrics controller error: listen tcp :8080: bind: address already in use
I0324 11:36:21.537453       1 network_routes_controller.go:1152] Could not find annotation `kube-router.io/bgp-local-addresses` on node object so BGP will listen on node IP: 176.9.30.135 address.
I0324 11:36:21.537664       1 bgp_peers.go:311] Received node 176.9.30.135 added update from watch API so peer with new node
I0324 11:36:21.537781       1 ecmp_vip.go:172] Received new service: rrc/fathom from watch API
I0324 11:36:21.538008       1 ecmp_vip.go:117] Skipping update to service: rrc/fathom, controller still performing bootup full-sync
I0324 11:36:21.538021       1 ecmp_vip.go:172] Received new service: kube-system/kube-dns-upstream from watch API
I0324 11:36:21.538031       1 ecmp_vip.go:117] Skipping update to service: kube-system/kube-dns-upstream, controller still performing bootup full-sync
< lots more logs >
OK looks like everything’s working well (and pods and the hosted sites are still working well), so I’m going to consider this done.
kubectl context with kubie/kubectx/kubensI’m getting a bit tired of typing -n <namespace> all the time, so it may be time to look into some context-remembering tools I came across for kubectl. I have kubectl aliased to k to at least save myself some typing there, so in keeping with that trend I’m going to also see if I can adapt to using one of the following:
Originally I was going to chose kubens simply because it has an Arch package, but it looks like kubie is tnnhe way to go:
kubie is an alternative to kubectx, kubens and the k on prompt modification script. It offers context switching, namespace switching and prompt modification in a way that makes each shell independent from others. It also has support for split configuration files, meaning it can load Kubernetes contexts from multiple files. You can configure the paths where kubie will look for contexts, see the settings section.
The feature set sounds convincing (though I definitely don’t need some of it), and it’s got a kubie-bin binary-only arch package (and it’s available via cargo install) so it looks like I’ll be going with kubie. Hopefully this saves some readers out there some typing!
Well this was a bear of a post to write, and is a VERY long blog post to read. That’s the first “upgrade sunday” for you (and I definitely didn’t finish on Sunday – it’s Wednesday now). Hopefully those of you following along at home learned something or found some new interesting tool/debugging idea you can take home or consider for your own cluster(s). I’m glad I was finally able to get this off my TODO list, and improve my cluster along the way.
Of course, the big thing I haven’t done is actually updating my cluster – I’m on Kubernetes 1.17 and the latest is 1.20! I’ll have to save that for next sunday.
